Copyright
©The Author(s) 2005.
World J Gastroenterol. Sep 28, 2005; 11(36): 5735-5738
Published online Sep 28, 2005. doi: 10.3748/wjg.v11.i36.5735
Published online Sep 28, 2005. doi: 10.3748/wjg.v11.i36.5735
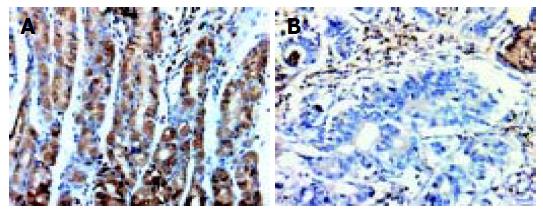
Figure 1 Positive FHIT expression in the normal gastric mucosa (A) and negative FHIT expression in cancer cells (B).
(SP ×200).
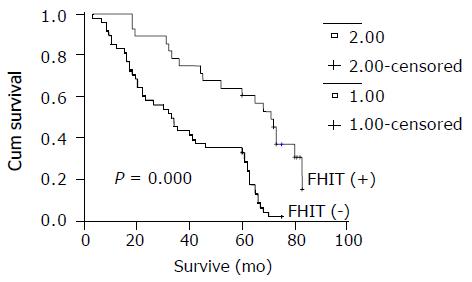
Figure 2 Difference in median survival time between carcinoma patients with and without FHIT expression ( n = 76).
The y-axis represents the percentage of patients, the x-axis represents their survival time. The red line represents FHIT-positive patients with a better survival, the green line represents FHIT-negative gastric carcinoma patients (log rank = 20.78; P = 0.000).
- Citation: Zhao P, Liu W, Lu YL. Clinicopathological significance of FHIT protein expression in gastric adenocarcinoma patients. World J Gastroenterol 2005; 11(36): 5735-5738
- URL: https://www.wjgnet.com/1007-9327/full/v11/i36/5735.htm
- DOI: https://dx.doi.org/10.3748/wjg.v11.i36.5735


