Copyright
©The Author(s) 2005.
World J Gastroenterol. Sep 28, 2005; 11(36): 5644-5650
Published online Sep 28, 2005. doi: 10.3748/wjg.v11.i36.5644
Published online Sep 28, 2005. doi: 10.3748/wjg.v11.i36.5644
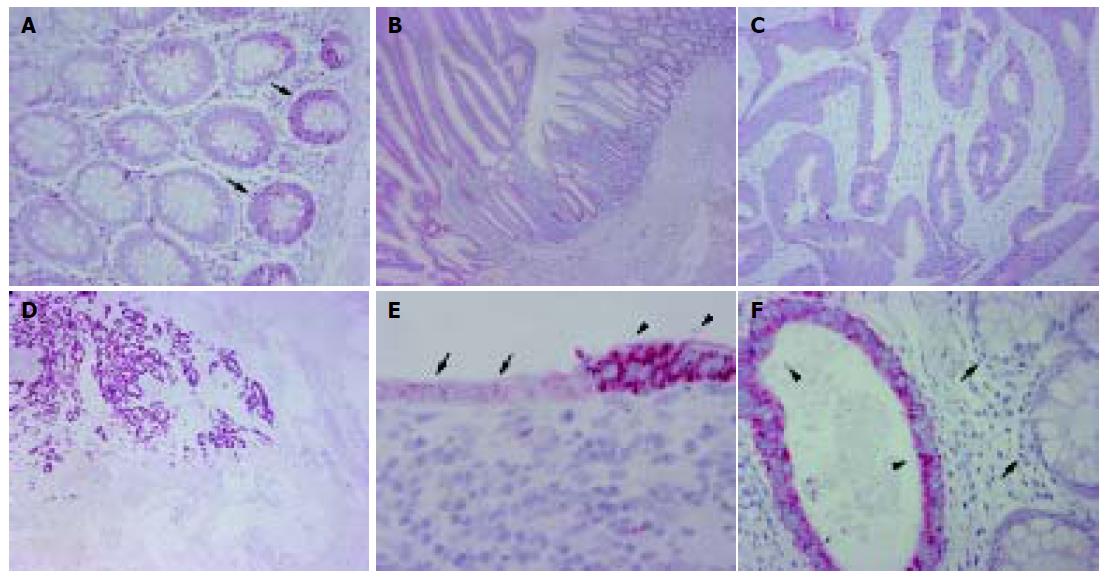
Figure 1 Expression of PLK1 in colon tissue.
A: PLK1 expression in epithelium of the basis of normal colon crypts (arrows); B: Weak PLK1 positivity in colon adenoma; C: Weak expression of PLK1 in colon carcinoma; D: Strong positivity for PLK1 in colon carcinoma infiltrating pericolonic soft tissue; E: Transition of slightly dysplastic colon epithelium (small arrows) into colon carcinoma (arrowheads). Note the abrupt onset of PLK1 expression; F : Overexpression of PLK1 in colon carcinoma (arrowheads) infiltrating normal colon mucosa (small arrows). Original magnifications A: ×200, B: ×50, C: ×100, D: ×20, E/F: ×400.
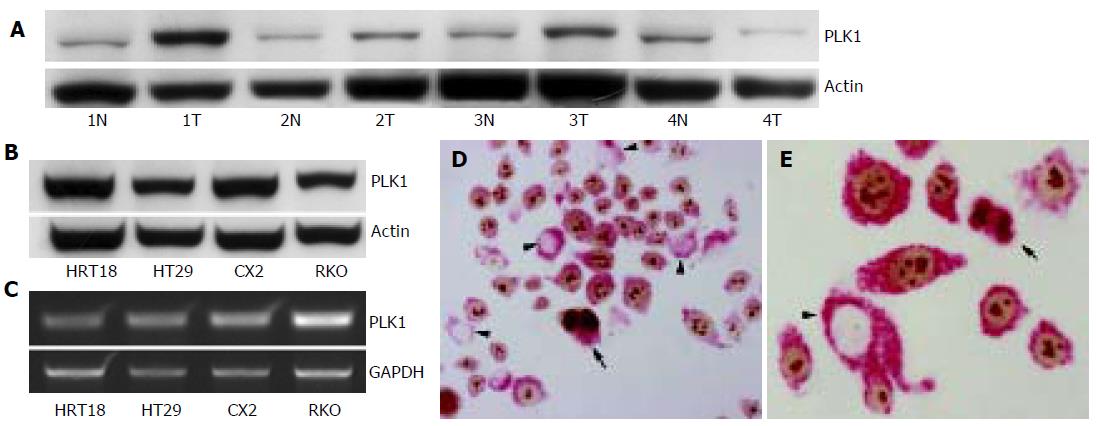
Figure 2 Expression of PLK1 in frozen colon tissue and colon carcinoma cell lines.
A: Expression of PLK1 protein (68 ku) in colon carcinoma and normal colon mucosa; B/C : Strong expression of PLK1 protein (B, immunoblot, 68 ku) and mRNA (C: RT-PCR, 1 807 bp) in colon carcinoma cell lines; D/E: Coexpression of PLK1 (red staining of the cytoplasm) and Ki-67 (brown staining of the nucleus) in RKO colon carcinoma cell line. A considerable number of cells were PLK1 positive, but remained Ki-67 negative (arrowheads). Note cells in M-phase (small arrows) strongly expressing both proteins. Original magnifications D: ×200, E: ×500.
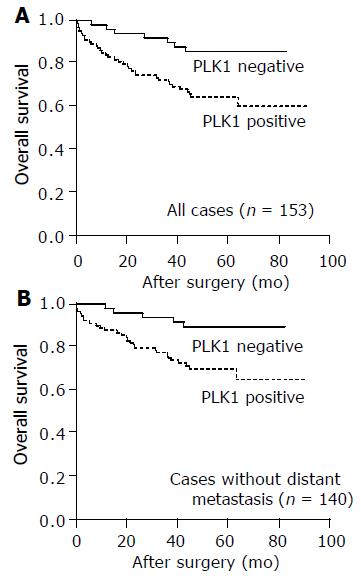
Figure 3 Correlation of PLK1 expression with patient survival in the whole study population (A) and in the subgroup of patients with locoregional disease (B).
- Citation: Weichert W, Kristiansen G, Schmidt M, Gekeler V, Noske A, Niesporek S, Dietel M, Denkert C. Polo-like kinase 1 expression is a prognostic factor in human colon cancer. World J Gastroenterol 2005; 11(36): 5644-5650
- URL: https://www.wjgnet.com/1007-9327/full/v11/i36/5644.htm
- DOI: https://dx.doi.org/10.3748/wjg.v11.i36.5644


