Copyright
©The Author(s) 2005.
World J Gastroenterol. Sep 28, 2005; 11(36): 5621-5626
Published online Sep 28, 2005. doi: 10.3748/wjg.v11.i36.5621
Published online Sep 28, 2005. doi: 10.3748/wjg.v11.i36.5621
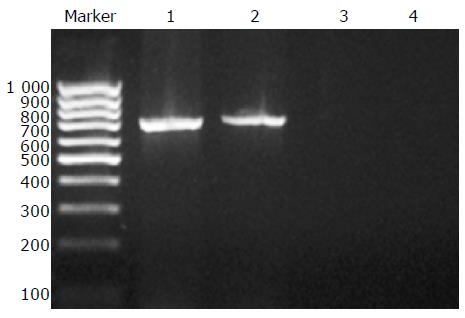
Figure 1 RT-PCR of TNFmRNA.
M: Marker; lanes 1 and 2: TNF group, BCT group; lanes 3 and 4: HepG2 group, ADM group.
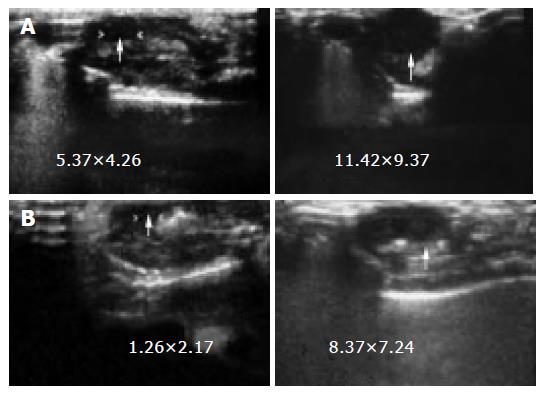
Figure 2 Size of tumor after chemotherapy in groups of HepG2 (A) and BCT (B).
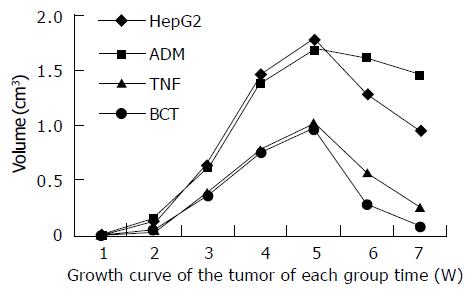
Figure 3 Growth curve of tumor in each group after chemotherapy.
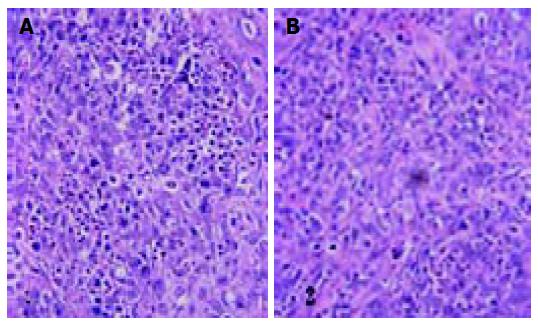
Figure 4 Histological characteristics of tumor in HepG2 group (A) and BCT group (B).
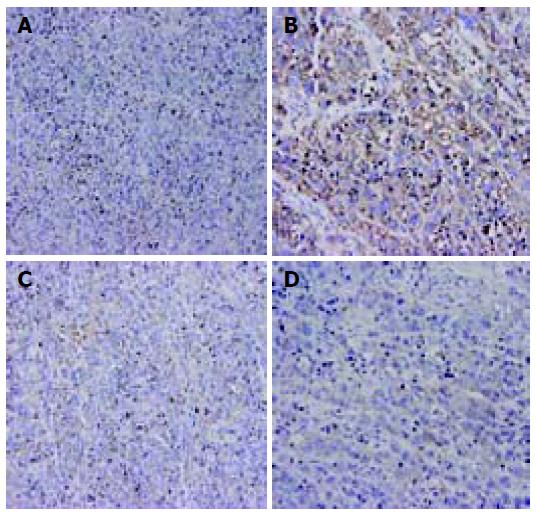
Figure 5 Pgp protein expression in groups of HepG2 (A), ADM (B), BCT (C), and TNF (D).
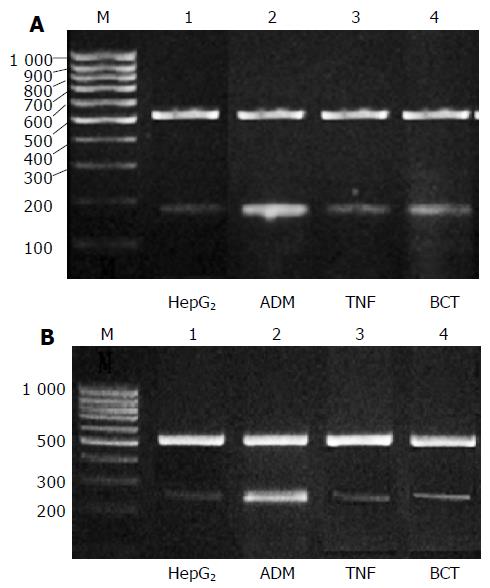
Figure 6 Expression of MDR1mRNA (A, 176 bp) and LRPmRNA (B, 237 bp).
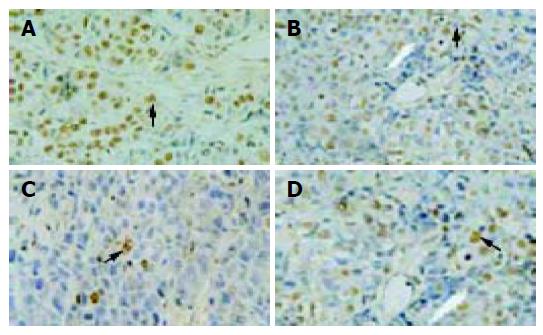
Figure 7 HHC cell apoptosis in groups of BCT (A), TNF (B), ADM (C), and HepG2 (D).
- Citation: Ding L, Chen XP, Zhang ZW, Guan J, Zhang WG, Wang HP, Wang ZH, Li CL. Synergistic effect of bromocriptine and tumor necrosis factor-α on reversing hepatocellular carcinoma multidrug resistance in nude mouse MDR1 model of liver neoplasm. World J Gastroenterol 2005; 11(36): 5621-5626
- URL: https://www.wjgnet.com/1007-9327/full/v11/i36/5621.htm
- DOI: https://dx.doi.org/10.3748/wjg.v11.i36.5621


