Copyright
©2005 Baishideng Publishing Group Inc.
World J Gastroenterol. Sep 21, 2005; 11(35): 5506-5511
Published online Sep 21, 2005. doi: 10.3748/wjg.v11.i35.5506
Published online Sep 21, 2005. doi: 10.3748/wjg.v11.i35.5506
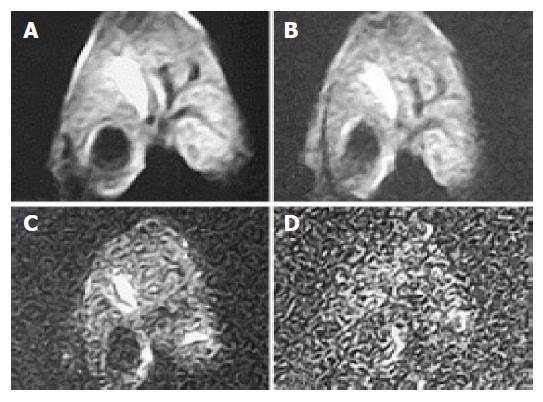
Figure 1 With b value, thickness, TR value, scanning coil and NEX were different, ADC value, the ability of liver anatomy manifestation or differentiation and SNR of rabbit liver on MR DWI were also different.
b value were respectively 10,100, 300 and 800 s/mm2 of the image (A), (B), (C) and (D). ADC value, SNR and the liver anatomy manifestation of the images became lower and lower with increasing b value. The distinction between b values 10 and 100 was insignificant and the diagnostic value of images at b value 800 was low.
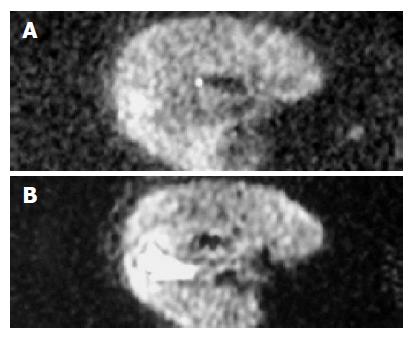
Figure 2 b value, the thickness and the NEX of image (A) were 300, 2 mm and 8 respectively while those of image (B) were 100, 2 mm and 1 respectively.
The quality and SNR of the images were poorer than that of Figure 3.
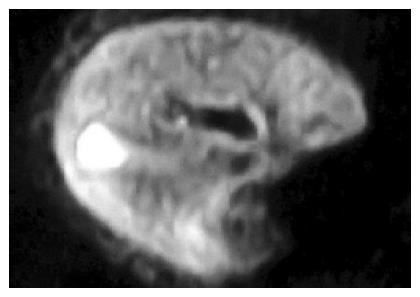
Figure 3 When b value was 100 and the thickness was 2 mm, SNR and the liver anatomy manifestation of the images were all good, while the artifact was low and the quality was high.
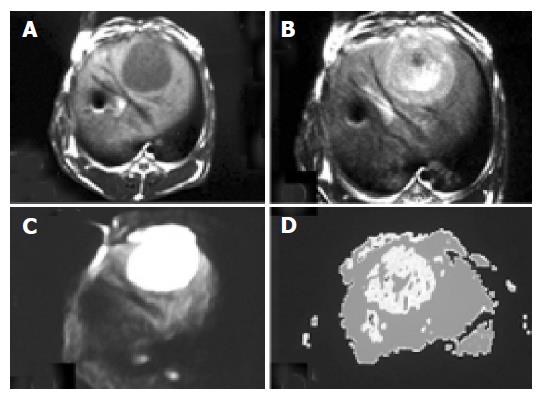
Figure 4 The VX-2 tumor manifests low signal on MR T1WI in image (A), while it displayed high signal on T2WI in image (B).
The VX-2 tumor manifested significantly high signal while surrounding hepatic parenchyma displayed low signal on DWI in image (C) with b value 100, TR 6 000 and thickness 2 mm,the distinction between the VX-2 tumor and surrounding hepatic parenchyma was significant and the border of the VX-2 tumor was clear. The image (D) is the ADC map from VX-2 tumor DWI of the image (C).
- Citation: Yuan YH, Xiao EH, He Z, Xiang J, Tang KL, Yan RH, Jin K, Peng ZW. MR diffusion-weighed imaging of rabbit liver. World J Gastroenterol 2005; 11(35): 5506-5511
- URL: https://www.wjgnet.com/1007-9327/full/v11/i35/5506.htm
- DOI: https://dx.doi.org/10.3748/wjg.v11.i35.5506


