Copyright
©The Author(s) 2005.
World J Gastroenterol. Sep 14, 2005; 11(34): 5273-5276
Published online Sep 14, 2005. doi: 10.3748/wjg.v11.i34.5273
Published online Sep 14, 2005. doi: 10.3748/wjg.v11.i34.5273
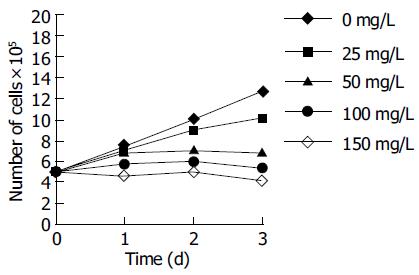
Figure 1 Effect of tea pigments on HepG2 cell growth.
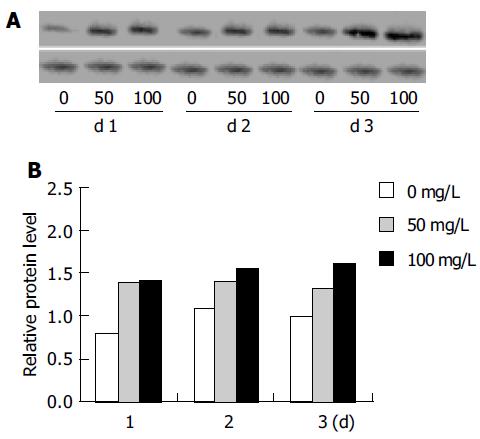
Figure 2 Upregulation of p21WAF1 protein expression in HepG2 cell lines treated with tea pigments visualized by ECL detection system (A) and plotted as relative protein level (B).
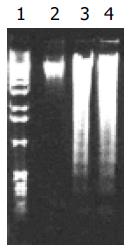
Figure 3 Induction of apoptosis by tea pigments in HepG2 cells.
Lane 1: DNA molecular weight marker; lane 2 (control): DNA collected from untreated HepG2 cells after 3 d; lanes 3 and 4: DNA collected from HepG2 cells treated with 100 mg/L after 2 and 3 d.
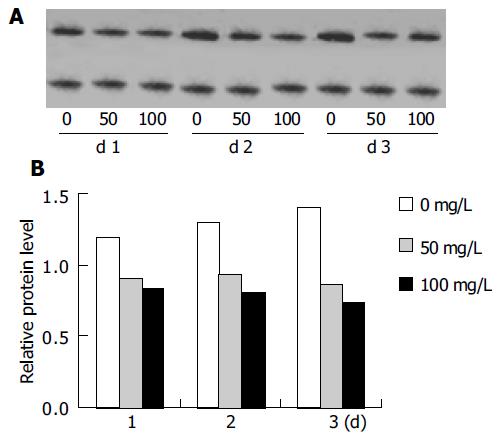
Figure 4 Downregulation of Bcl-2 protein expression in HepG2 cell lines treated with tea pigments visualized by ECL detection system (A) and plotted as relative protein level (B).
- Citation: Jia XD, Han C, Chen JS. Tea pigments induce cell-cycle arrest and apoptosis in HepG2 cells. World J Gastroenterol 2005; 11(34): 5273-5276
- URL: https://www.wjgnet.com/1007-9327/full/v11/i34/5273.htm
- DOI: https://dx.doi.org/10.3748/wjg.v11.i34.5273


