Copyright
©The Author(s) 2005.
World J Gastroenterol. Sep 7, 2005; 11(33): 5235-5238
Published online Sep 7, 2005. doi: 10.3748/wjg.v11.i33.5235
Published online Sep 7, 2005. doi: 10.3748/wjg.v11.i33.5235
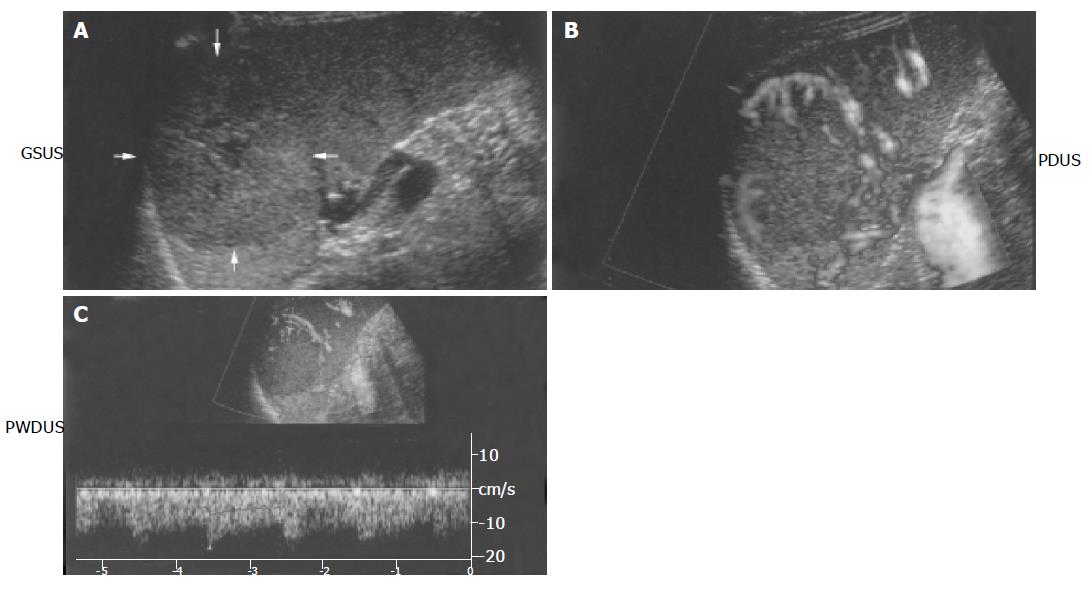
Figure 1 Splenic hamartoma on ultrasonogram.
A: A homogeneous hamartoma on gray-scale sonogram with evidence of cystic changes in the mass (arrows); B: multiple circular blood flow signals within the mass on power Doppler sonogram (basket pattern); C: arterial and venous flow in the mass on duplex Doppler sonogram.
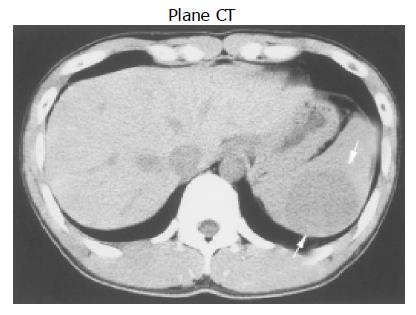
Figure 2 A low-density mass in the spleen shown by plane CT scan (arrows).
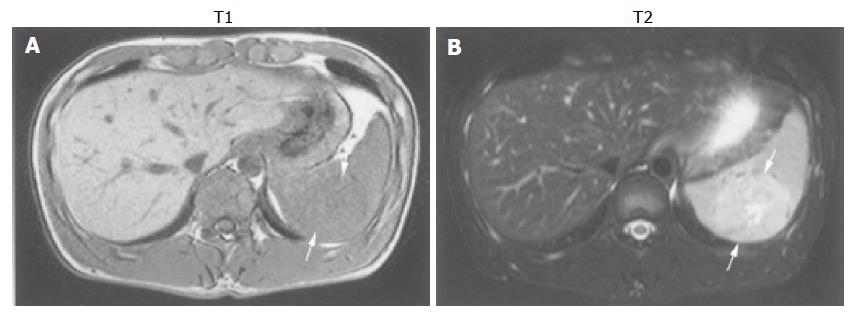
Figure 3 Isointense mass on standard T1-weighed MRI mass on (A) and mild hyperintense T2-weighed MRI (arrows B).
Figure 4 Dilated vessels (arrowheads) and border of the mass and normal splenic parenchyma (arrows) (A) and a mass consisting of red pulp (B) (HE×100).
- Citation: Nakanishi S, Shiraki K, Yamamoto K, Nakano T, Koyama M, Yano T, Sanda T, Tamaki H, Hirano T, Fukudome K, Ishihara A. Basket pattern blood flow signals discovered in a case of splenic hamartoma by power Doppler ultrasonography. World J Gastroenterol 2005; 11(33): 5235-5238
- URL: https://www.wjgnet.com/1007-9327/full/v11/i33/5235.htm
- DOI: https://dx.doi.org/10.3748/wjg.v11.i33.5235


