Copyright
©The Author(s) 2005.
World J Gastroenterol. Sep 7, 2005; 11(33): 5203-5208
Published online Sep 7, 2005. doi: 10.3748/wjg.v11.i33.5203
Published online Sep 7, 2005. doi: 10.3748/wjg.v11.i33.5203
Figure 1 The borders of the respective cell regions of lymphocytes (L), monocytes (M) and granulocytes (G) were clearly defined on the cytograms of flow cytometry based on the size and the granularity (x-axis, forward scattered cells and y-axis, side scattered cells of cells after surface immunostaining) (A); Histograms from gated monocytes obtained from fluorescent activated cell sorter analysis of HCV-infected peripheral blood mononuclear leukocytes.
Cells were stained with anti-E1 antibody against HCV E1 region. Histograms represent gated monocytes from (B1) infected cells stained with normal rabbit serum as control or (B2) infected cells stained with antibody against E1 after incubation of blood with serum sample after 1 h at 37 °C in which x-axis represents fluorescence intensity. M1 is marker for positive cell population.
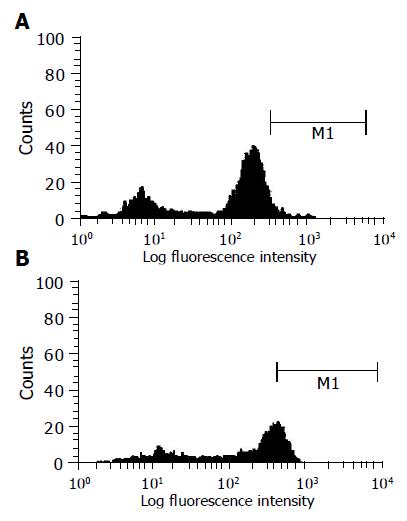
Figure 2 Histogram from gated leukocytes obtained from fluorescent activated cell sorter analysis of HCV-infected peripheral blood mononuclear leukocytes.
Cells were stained intracellularly with anti-C2 antibody conjugated with FITC. Histogram represents gated leukocytes from (A) healthy uninfected cells or (B) infected cells stained with anti-C2 antibody conjugated with FITC after incubation of blood with serum sample after 24 h at 37 °C in which x-axis represents fluorescence intensity. M1 is marker for positive cell population.
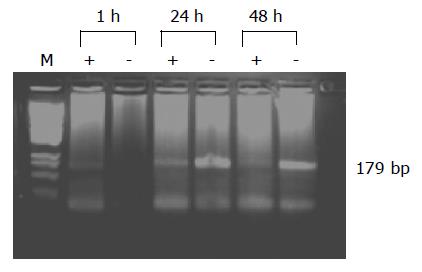
Figure 3 Analysis of HCV RNA plus strand and minus strand from infected PBMC.
PCR amplification products of the genomic strand (+) and the replicative strand (-) of HCV from total cellular RNA of PBMC infected with HCV for 1, 24 and 48 h. Lane M represents the M.W. marker PGem.
- Citation: El-Awady MK, Tabll AA, Redwan ERM, Youssef S, Omran MH, Thakeb F, El-Demellawy M. Flow cytometric detection of hepatitis C virus antigens in infected peripheral blood leukocytes: Binding and entry. World J Gastroenterol 2005; 11(33): 5203-5208
- URL: https://www.wjgnet.com/1007-9327/full/v11/i33/5203.htm
- DOI: https://dx.doi.org/10.3748/wjg.v11.i33.5203


