Copyright
©The Author(s) 2005.
World J Gastroenterol. Sep 7, 2005; 11(33): 5136-5141
Published online Sep 7, 2005. doi: 10.3748/wjg.v11.i33.5136
Published online Sep 7, 2005. doi: 10.3748/wjg.v11.i33.5136
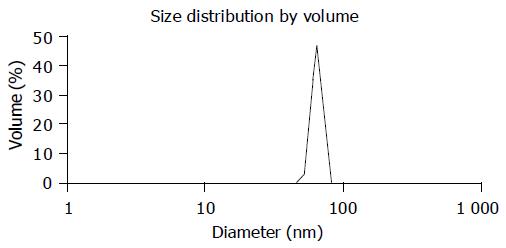
Figure 1 Size distribution of chitosan nanoparticles.
Figure 2 Zeta potential distribution of chitosan nanoparticles (A) and chitosan (B) in 0.
25% acetic acid solution.
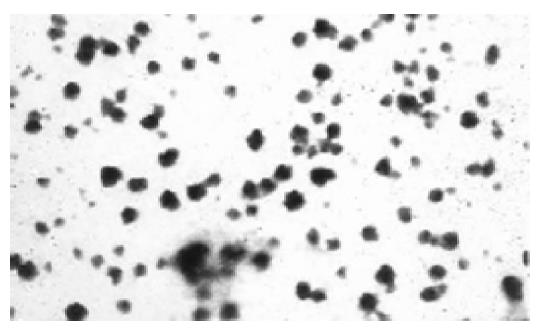
Figure 3 TEM photograph of chitosan nanoparticles.
The bar stands for 100 nm.
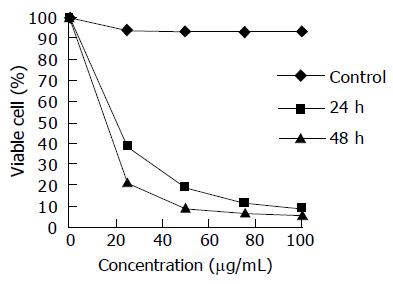
Figure 4 Inhibition of chitosan nanoparticles on MGC803 cell proliferation.
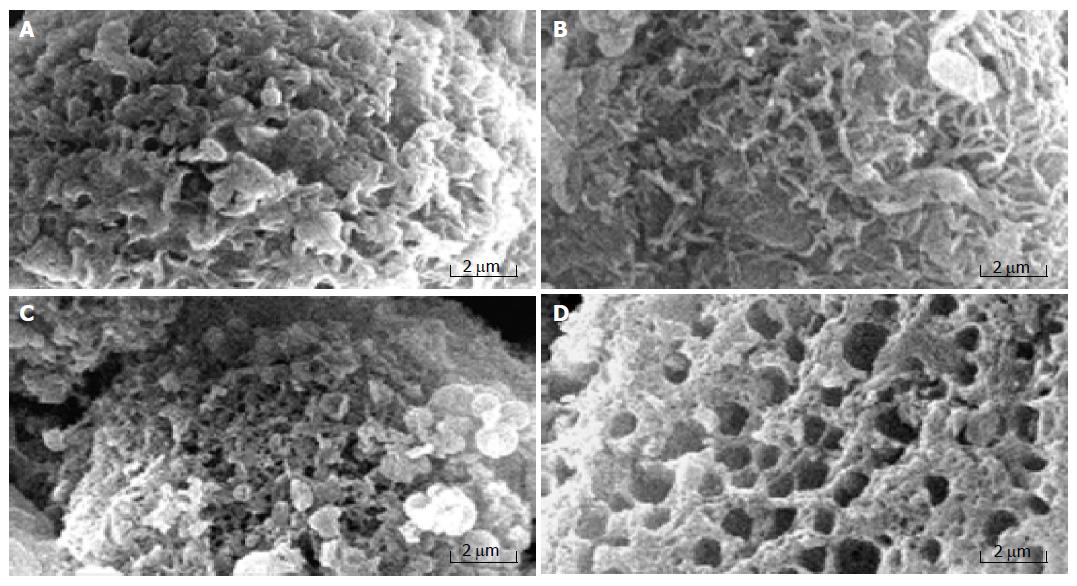
Figure 5 Surface morphology of control cells (A) and MGC803 cells treated with 100 μg/mL chitosan nanoparticles for 30 min (B), 2 h (C), and 4 h (D).
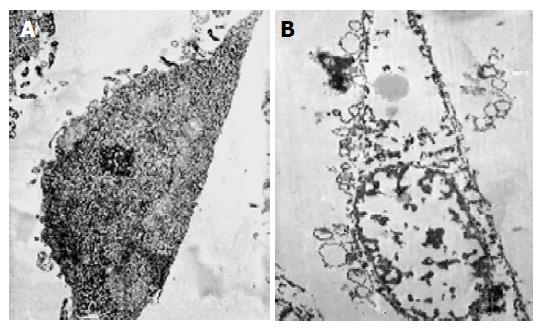
Figure 6 Transmission electron microscopic photographs of MGC803 cells cultured for 24 h in the absence (A) or presence of 100 μg/mL chitosan nanoparticles (B) in vitro (TEM, ×5 000).
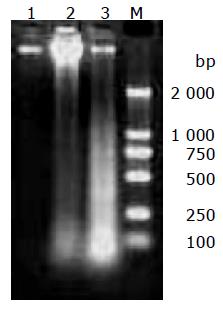
Figure 7 Agarose gel electrophoretic analysis of DNA isolated from MGC803 cells incubated with 100 μg/mL chitosan nanoparticles for 6 h (lane 2) and 24 h (lane 3) or without treatment (lane 1).
M: a DNA marker.
Figure 8 Chitosan nanoparticles-induced changes of MMP.
A: Loss of MMP; B: histogram of untreated cells; C: histogram of cells treated with 100 μg/mL chitosan nanoparticles.
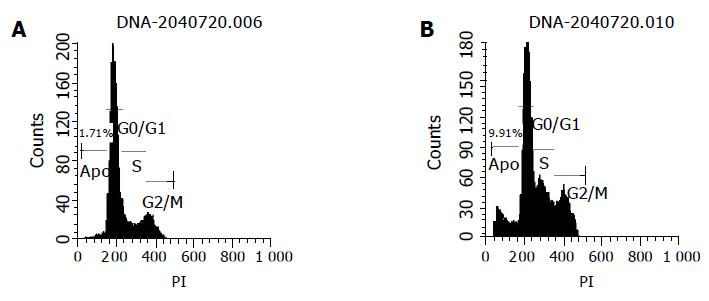
Figure 9 Effect of chitosan nanoparticles on cell cycle (A) and apoptotic incidence (B) of MGC803 cells.
- Citation: Qi LF, Xu ZR, Li Y, Jiang X, Han XY. In vitro effects of chitosan nanoparticles on proliferation of human gastric carcinoma cell line MGC803 cells. World J Gastroenterol 2005; 11(33): 5136-5141
- URL: https://www.wjgnet.com/1007-9327/full/v11/i33/5136.htm
- DOI: https://dx.doi.org/10.3748/wjg.v11.i33.5136


