Copyright
©The Author(s) 2005.
World J Gastroenterol. Aug 7, 2005; 11(29): 4497-4504
Published online Aug 7, 2005. doi: 10.3748/wjg.v11.i29.4497
Published online Aug 7, 2005. doi: 10.3748/wjg.v11.i29.4497
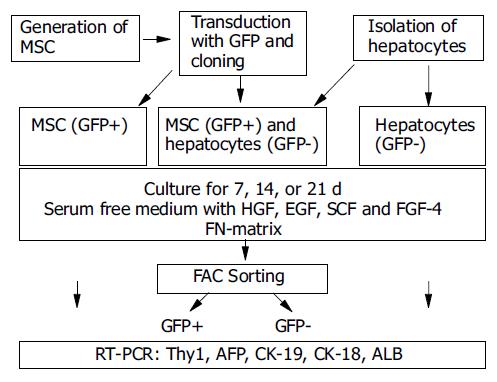
Figure 1 Experimental design.
rMSC were harvested from rat bone marrow and were transduced with GFP and cloned. Cloned GFP+ rMSC were expanded and either seeded with hepatocytes in cocultures or alone. Controls included hepatocytes cultured alone. Cells were cultured for 7, 14, or 21 d. Cocultured cells were sorted by FACS into GFP+ (rMSC-derived) or GFP- (hepatocyte-derived) cells. Gene expression analysis for stem cell marker or liver specific genes was performed by RT-PCR.
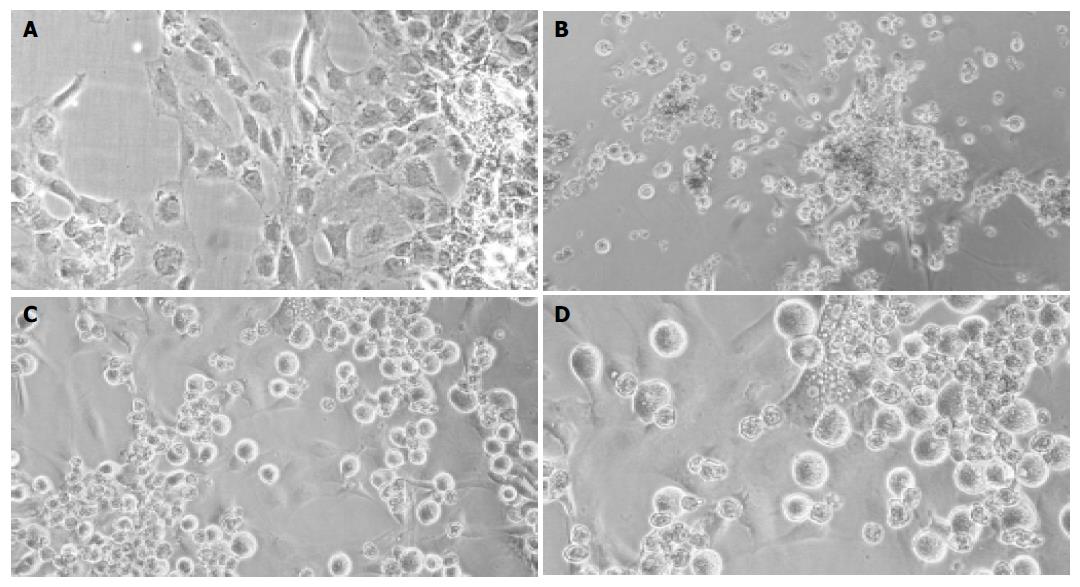
Figure 2 Light-microscopic pictures of cultured cells.
Cultured rMSC (A), hepatocyte controls (B), or cocultures of rMSC with hepatocytes (C + enlargement D) after 3 wk. Cultured rMSC grew adherent and adopted a polygonal cell morphology after weeks in culture (A). Hepatocytes formed clumps of rounded cells, and few viable cells were observed after 3 wk in culture (B). In mixed cultures, mainly MSC attached to the substratum, whereas hepatocytes grew over the MSC-layer forming clusters (C). Binucleated cells were found within the attached layer of the cultured MSC beginning with 1 wk in culture. Shown is one example at wk 2 out of three experiments. Original magnification ×200.
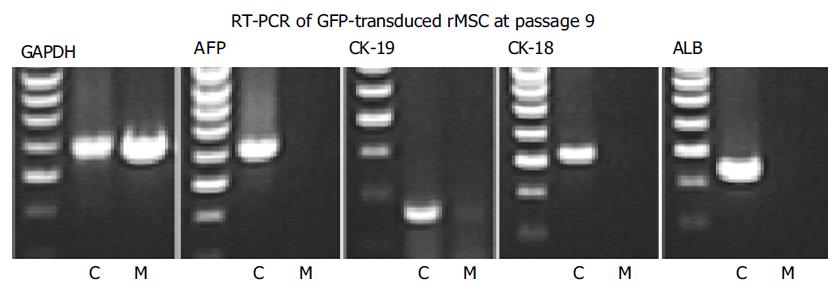
Figure 3 RT-PCR analysis of cloned GFP+ rMSC.
rMSC (M) and liver control cells (C) were investigated before differentiation. GAPDH showed a strong signal in both liver controls and rMSC, whereas no liver specific genes (AFP, CK-19, CK-18, and albumin ALB) were expressed in GFP+rMSC (results from one out of three experiments).
Figure 4 FACS-pictograms.
One example out of three experiments from sorting of GFP+ and GFP- cells of cocultures at wk 2 is shown. A: Viable cells were gated as P1; B: P1 cells were gated in GFP- or GFP+ (P2); C: For highest purification of GFP+ cells, P2 was analyzed and only GFP+ cells were sorted in the sample tube for PCR-analysis (dark gray peak). 80.8% of cells from P2 were GFP+(sorted into the GFP+ test tube) and 19.2% were GFP-.
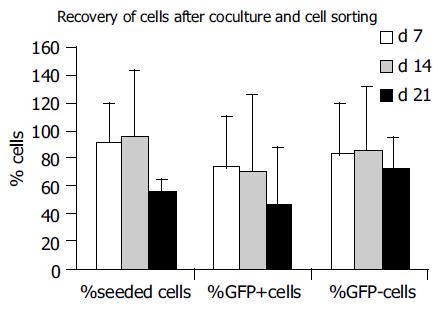
Figure 5 Recovery of cultured cells in cocultures.
Recovery of seeded cells decreased from 91.6±28.8 % in the 1st wk towards 56.7±8.6 % in the 3rd wk (data from 3 experiments). Recovery of GFP+ cells decreased from 72.2 ± 38.5% to 46.3±41.6%, and recovery of GFP-cells from 81.9±38.2 % to 71.5±24.3 % from the 1st to the 3rd wk in culture, respectively.
Figure 6 Gene expression profile.
Cultured rMSC, hepatocytes (rHep), and GFP+ or GFP- cells of the cocultures after 1-3 wk were investigated for their expression of the stem cell marker Thy1 (A) and of the liver specific markers AFP (B), CK-19 (C), CK-18 (D), or albumin (E). Results from one out of three experiments are shown. rMSC (lane rMSC), GFP- (lane GFP- cocultures) or GFP+ (lane GFP+ cocultures) cells showed a stable Thy1 gene expression over the whole observation period, whereas hepatocytes (lane rHep) showed no signal for Thy1 gene expression in the RT-PCR analysis (A). In cultures of hepatocytes, GFP- or GFP+ cells show, the expression of the studied liver markers was observed, whereas in cultured rMSC none of the studied liver specific genes was observed at all time points (B-E). Cultured hepatocytes expressed AFP and CK-19 weakly (B and C), and CK-18 (D) and albumin (E) stable. GFP- cells from cocultures showed a stable expression of AFP (B), CK-19 (C) or albumin (E), and a weak signal for CK-18 expression (D). The GFP+ cells showed a stable expression of the liver specific genes AFP (B), CK-18 (D), and albumin (E), and a weak expression of CK-19 (C) over the whole observation period.
- Citation: Lange C, Bassler P, Lioznov MV, Bruns H, Kluth D, Zander AR, Fiegel HC. Liver-specific gene expression in mesenchymal stem cells is induced by liver cells. World J Gastroenterol 2005; 11(29): 4497-4504
- URL: https://www.wjgnet.com/1007-9327/full/v11/i29/4497.htm
- DOI: https://dx.doi.org/10.3748/wjg.v11.i29.4497


