Copyright
©The Author(s) 2005.
World J Gastroenterol. Jul 21, 2005; 11(27): 4180-4187
Published online Jul 21, 2005. doi: 10.3748/wjg.v11.i27.4180
Published online Jul 21, 2005. doi: 10.3748/wjg.v11.i27.4180
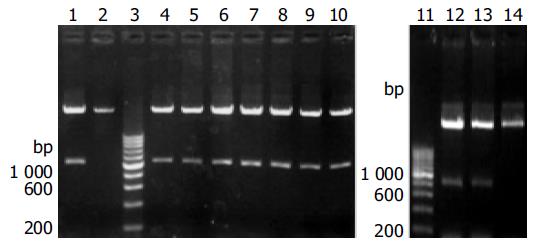
Figure 1 Identification of clones with correct sized inserts, using NdeI/BamHI double digestion.
Lanes 1 and 4-8: pET-A2 clones from donors 1 and 2; lanes 2 and 14: pET-3c; lanes 3 and 11: 200-bp DNA ladder; lanes 9 and 10: pET-A2 clones from donor 3; lanes 12 and 13: pET-A2-BSP.
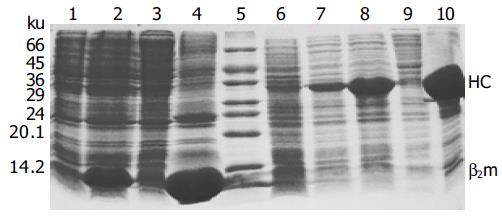
Figure 2 SDS-PAGE (150 g/L) analyses of recombinant A2-BSP and β2m proteins expressed in E.
coli strain BL21(DE3). Lane 1: BL21 (pET-β2m) before IPTG induction; lane 2: BL21 (pET-β2m)+IPTG; lane 3: supernatant of BL21 (pET-β2m) lysate; lane 4: washed inclusion body of β2m; lane 5: MW marker; lane 6: BL21 (pET-3c)+IPTG; lane 7: BL21 (pET-A2-BSP) before IPTG induction; lane 8: BL21 (pET-A2-BSP)+IPTG; lane 9: supernatant of BL21 (pET-A2-BSP) lysate; lane 10: washed inclusion body of A2-BSP. HC: heavy chain.
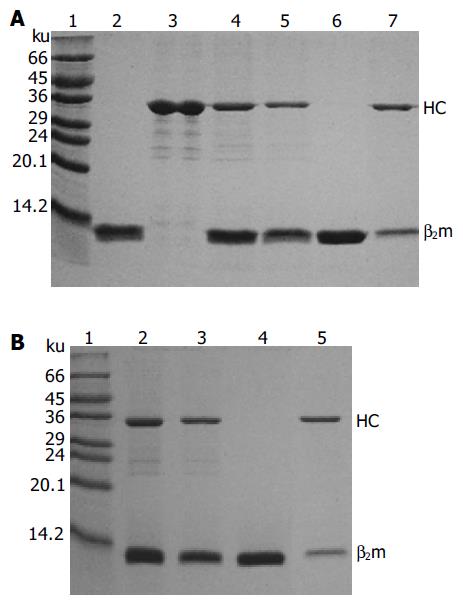
Figure 3 Analyses of refolded A2-GIL (A) and A2-NLV (B) monomers after purification and biotinylation with SDS-PAGE (150 g/L).
In (A) lane 1: protein MW marker; lane 2: solubilized β2m; lane 3: solubilized A2-BSP; lane 4: refolded A2-GIL monomer; lane 5: biotinylated A2-GIL monomer; lane 6: peak I (β2m) (Figure 4); lane 7: peak II (purified A2-GIL). In (B) lane 1: protein MW marker; lane 2: refolded A2-NLV monomer; lane 3: biotinylated A2-NLV monomer; lane 4: peak I (β2m); lane 5: peak II (purified A2-NLV). HC: heavy chain.
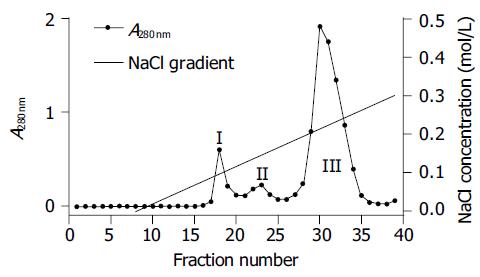
Figure 4 A typical elution profile of biotinylated HLA-A2 monomer from Q-Sepharose (fast flow) column (2 cm×8 cm).
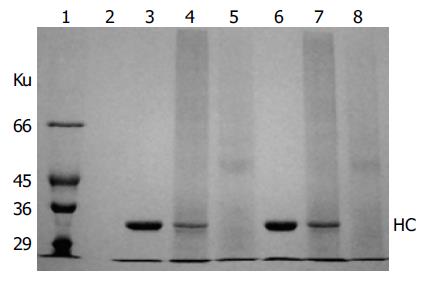
Figure 5 SDS-PAGE (75 g/L) analyses of A2-NLV and A2-GIL tetramers under non-reducing conditions without boiling.
Lane 1: protein MW marker; lane 2: empty; lane 3: A2-NLV monomer (5 μg); lane 4: A2-NLV tetramer (5 μg A2-NLV monomer+8 μg streptavidin-PE); lanes 5 and 8: streptavidin-PE (8 μg); lane 6: A2-GIL monomer (5 μg); lane 7: A2-GIL tetramer (5 μg A2-GIL monomer+8 μg streptavidin-PE). HC: heavy chain.
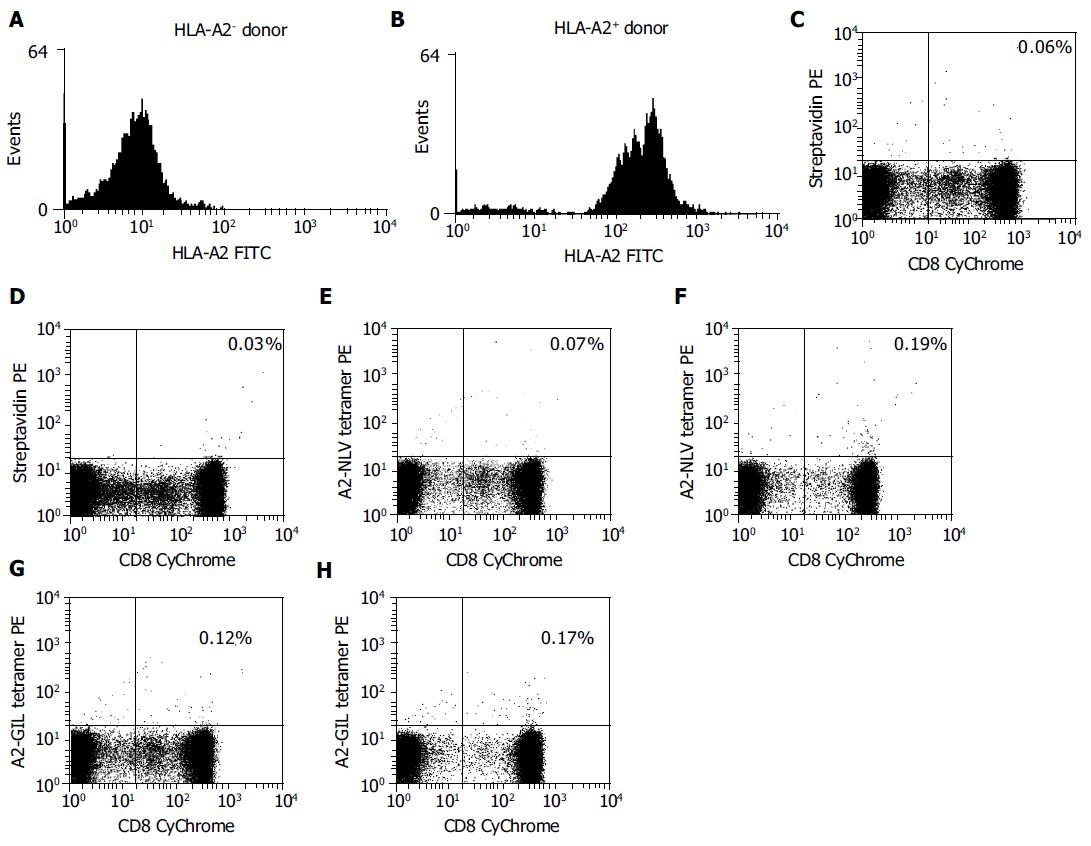
Figure 6 Flow cytometry of antigen-specific CD8+ T cells stained with A2-NLV tetramer (panels E and F) and A2-GIL tetramer (panels G and H) from both HLA- A2 positive (B) and negative (A) donors.
Background staining was performed with streptavidin-PE instead of the tetramers (C and D).
- Citation: He XH, Xu LH, Liu Y. Procedure for preparing peptide-major histocompatibility complex tetramers for direct quantification of antigen-specific cytotoxic T lymphocytes. World J Gastroenterol 2005; 11(27): 4180-4187
- URL: https://www.wjgnet.com/1007-9327/full/v11/i27/4180.htm
- DOI: https://dx.doi.org/10.3748/wjg.v11.i27.4180


