Copyright
©The Author(s) 2005.
World J Gastroenterol. Jul 21, 2005; 11(27): 4154-4160
Published online Jul 21, 2005. doi: 10.3748/wjg.v11.i27.4154
Published online Jul 21, 2005. doi: 10.3748/wjg.v11.i27.4154
Figure 1 Photomicrograph of macroscopic appearance of the glandular mucosa, showing the effect of AE (A) and Indo (C) in the absence (A and C) and presence of 10 μg/kg dose of leptin (B and D).
These photographs are typical of six such tissues.
Figure 2 A: The ulcer indices of saline and different concentrations of leptin (1-50 μg/kg) against Indo.
Each value is a mean±SE. Asterisks indicate significant difference when compared to saline control (aP < 0.05, bP < 0.01); B: The degree of prevention of Indo-induced ulcerations after treatment with different doses of lansoprazole and omeprazole (each used at 1-10 mg/kg), leptin (10 μg/kg) and ranitidine (50 mg/kg). Each value is a mean±SE. Asterisks indicate significant difference (dP < 0.001) when compared to saline control.
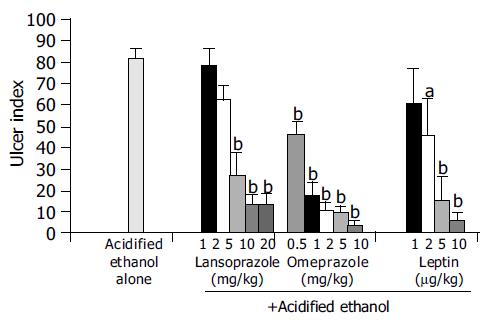
Figure 3 The effect of increasing doses of leptin (1-10 μg/kg), lansoprazole (1-10 mg/kg), and omeprazole (0.
5-10 mg/kg) on AE-induced ulceration in rats. Each value is a mean±SE. Asterisks indicate significant difference, aP < 0.05, bP < 0.001 vs controls.
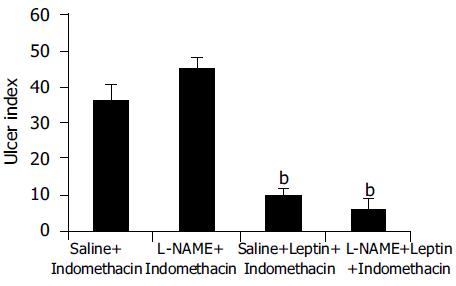
Figure 4 The ulcer prevention ability of leptin (10 μg/kg), when Indo was used to induce ulcer in L-NAME-pretreated animals.
Each value is a mean±SE. Asterisks indicate significant difference, bP < 0.001 vs controls.
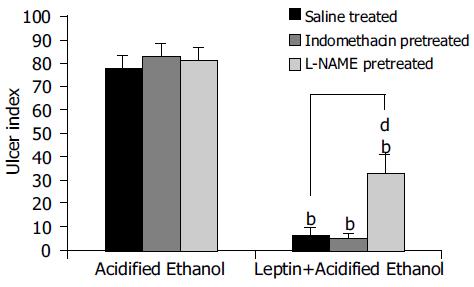
Figure 5 The ulcer prevention ability of leptin (10 μg/kg), in AE-induced ulcer after Indo or L-NAME pretreatment.
Each value is a mean±SE. Asterisks indicate significant difference, bP < 0.001 vs controls. dP < 0.001 shows the significant difference in the effect of leptin on saline-treated and L-NAME-pretreated rats.
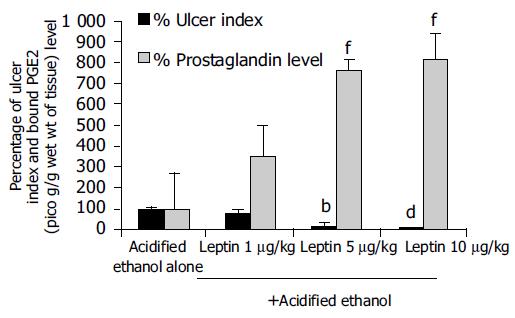
Figure 6 The effect of increasing doses of leptin (1-10 μg/kg) on AE-induced ulcer and prostaglandin E2 levels in the gastric glandular mucosa in rats.
Each value is a mean±SE. bP < 0.01, dP < 0.001 indicate significant difference in percentage ulcer index compared to AE-treated rats taken as 100%. fP < 0.01 shows the significant difference in the level of prostaglandin E2 compared to AE-treated rats taken as 100%.
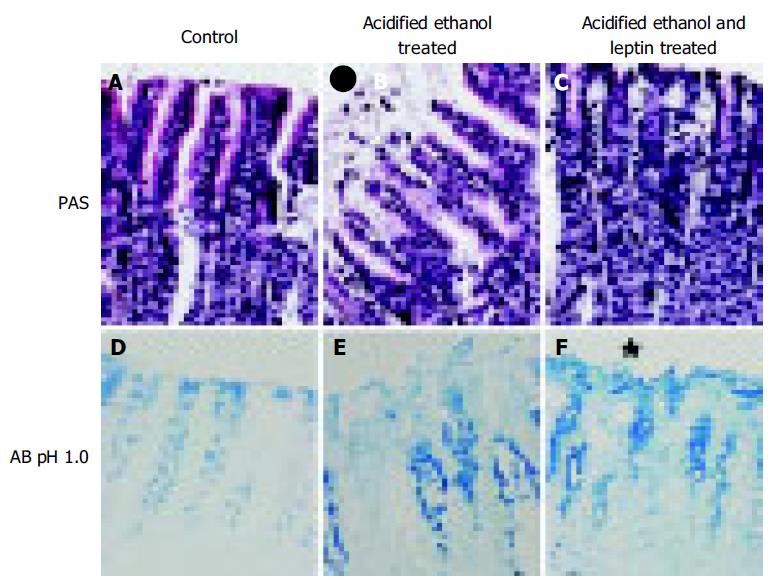
Figure 7 Gastric mucosal layer of rats stained with PAS showing (A) normal epithelium from control rats; (B) damaged epithelium (●) and (C) repaired epithelium after leptin treatment.
Lower panel shows the AB (pH 1.0) staining showing mucus in (D) normal epithelium; (E) loss of epithelial mucus due to AE (★) and (F) presence of epithelial mucus after leptin treatment (bar = 6 μm; magnification 40×).
- Citation: Adeyemi EO, Bastaki SA, Chandranath IS, Hasan MY, Fahim M, Adem A. Mechanisms of action of leptin in preventing gastric ulcer. World J Gastroenterol 2005; 11(27): 4154-4160
- URL: https://www.wjgnet.com/1007-9327/full/v11/i27/4154.htm
- DOI: https://dx.doi.org/10.3748/wjg.v11.i27.4154


