Copyright
©The Author(s) 2005.
World J Gastroenterol. Jul 7, 2005; 11(25): 3871-3876
Published online Jul 7, 2005. doi: 10.3748/wjg.v11.i25.3871
Published online Jul 7, 2005. doi: 10.3748/wjg.v11.i25.3871
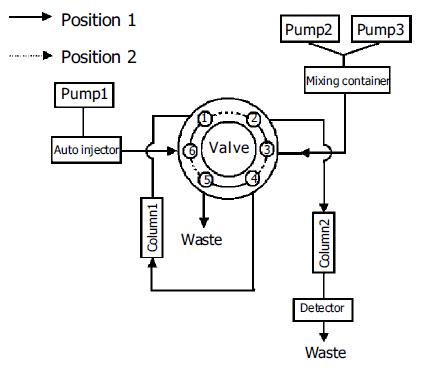
Figure 1 Schematic diagram of the column-switching HPLC system.
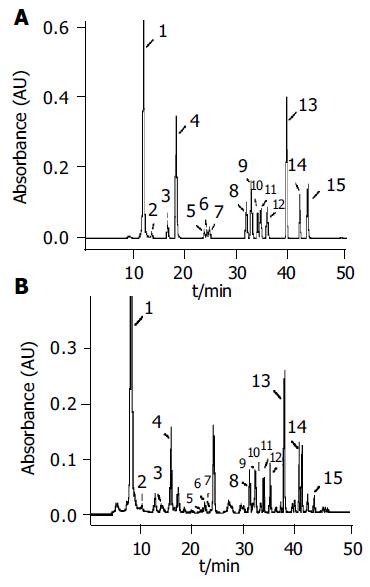
Figure 2 Typical chromatograms of (A) 14 standard nucleoside mixtures (B) urinary nucleosides of a normal urine obtained under the established analysis conditions.
Column-switching HPLC conditions as Table 2. Peak identification: 1 Pseu; 2 C; 3 U; 4 m1A; 5 I; 6 m5U; 7 G; 8 m1I; 9 m1G; 10 ac4C; 11 m2G; 12 A; 13 m22G; 14 Br8G; 15 m6A.
Figure 3 PCA based on 14 nucleoside concentrations from healthy controls (+) and patients with colorectal cancer (o).
A: Positions of patients with intestinal villous adenoma (*) were marked into the figure based on classification equation from healthy controls and patients with colorectal cancer; B: Positions of 32 of responsive cases after surgery (*) were marked into the figure based on classification equation from healthy controls and patients with colorectal cancer; C: Positions of 11 of progressive cases after surgery (*) were marked into the figure based on classification equation from healthy controls and patients with colorectal cancer.
- Citation: Zheng YF, Yang J, Zhao XJ, Feng B, Kong HW, Chen YJ, Lv S, Zheng MH, Xu GW. Urinary nucleosides as biological markers for patients with colorectal cancer. World J Gastroenterol 2005; 11(25): 3871-3876
- URL: https://www.wjgnet.com/1007-9327/full/v11/i25/3871.htm
- DOI: https://dx.doi.org/10.3748/wjg.v11.i25.3871


