Copyright
©2005 Baishideng Publishing Group Inc.
World J Gastroenterol. Jun 21, 2005; 11(23): 3533-3538
Published online Jun 21, 2005. doi: 10.3748/wjg.v11.i23.3533
Published online Jun 21, 2005. doi: 10.3748/wjg.v11.i23.3533
Figure 1 Time course of cobalt chloride effect on lipid peroxidation and on liver GSH content.
Data are mean±SD, n = 6. bP<0.01 as assessed by Student’s t-test. Values measured in control (vehicle-injected) animals were the same as those at 0 time.
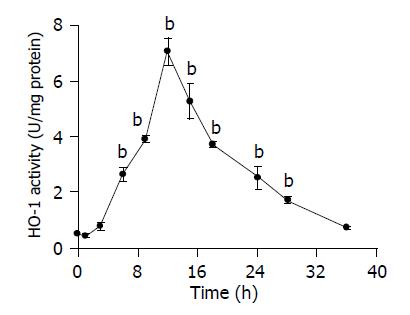
Figure 2 Time course of cobalt chloride effect on heme oxygenase activity in rat liver.
Data are mean±SD, n = 6. bP<0.01 as assessed by Student’s t-test. Values measured in control (vehicle-injected) animals were the same as those at 0 time.
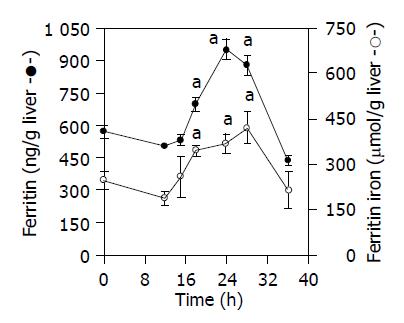
Figure 3 Time course of cobalt chloride effect on ferritin and ferritin iron contents.
Data are mean±SD, n = 6. aP<0.05 as assessed by Student’s t-test. Values measured in control (vehicle-injected) animals were the same as those at 0 time.
Figure 4 Effect of glutamine on.
A: TBARS content; B: intrahepatic GSH levels, and; C: HO-1 activity. Glutamine (300 mg/kg) was administered by gavage 24 h before cobalt treatment. For TBARS and GSH content, rats were killed 3 h after Co injection, and for HO-1 activity, rats were killed 12 h after cobalt injection. Data are mean±SD, n = 6. aP<0.05 vs Co group, bP<0.01 vs Control group.
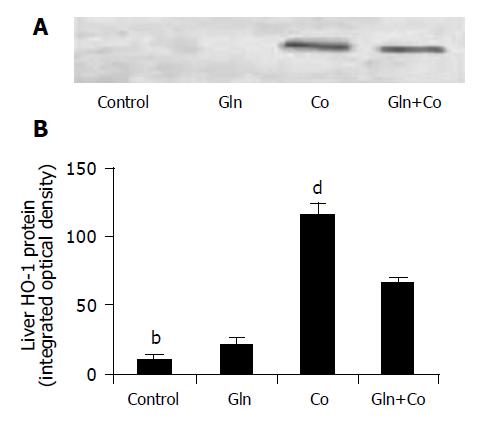
Figure 5 Western blot analysis of HO-1 expression in liver.
A: Rats were killed 12 h after Co treatment. Densitometry was done to quantify HO-1 protein expression; B: The blot is representative of three blots with a total of 4-5 samples/group between the three blots. bP<0.01 vs control group. dP<0.01 vs Co group.
-
Citation: Gonzales S, Polizio AH, Erario MA, Tomaro ML. Glutamine is highly effective in preventing
in vivo cobalt-induced oxidative stress in rat liver. World J Gastroenterol 2005; 11(23): 3533-3538 - URL: https://www.wjgnet.com/1007-9327/full/v11/i23/3533.htm
- DOI: https://dx.doi.org/10.3748/wjg.v11.i23.3533


