Copyright
©2005 Baishideng Publishing Group Inc.
World J Gastroenterol. Jun 14, 2005; 11(22): 3485-3489
Published online Jun 14, 2005. doi: 10.3748/wjg.v11.i22.3485
Published online Jun 14, 2005. doi: 10.3748/wjg.v11.i22.3485
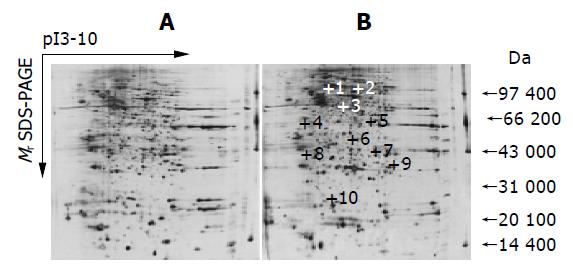
Figure 1 2-DE maps of untreated (A) and H pylori-treated HepG2 (B) cell proteins.
The proteins from cells were extracted and separated on a pH 3-10 IPG strip, followed by a 12.5% SDS-polyacrylamide gel and silver staining. Spots that were found to be overexpressed have been annotated.
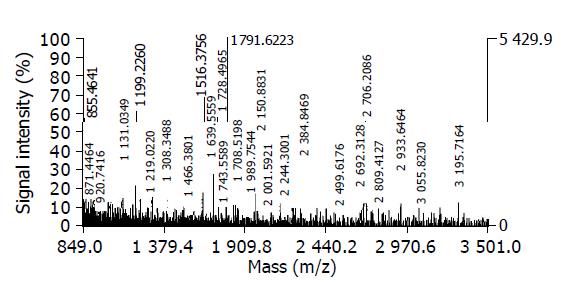
Figure 2 Peptide mass fingerprinting of the spot 10.
The spot was in-gel digested with trypsin. After desalting, the peptide mixture was analyzed by MALDI-TOF-MS.
-
Citation: Zhang Y, Fan XG, Chen R, Xiao ZQ, Feng XP, Tian XF, Chen ZH. Comparative proteome analysis of untreated and
Helicobacter pylori -treated HepG2. World J Gastroenterol 2005; 11(22): 3485-3489 - URL: https://www.wjgnet.com/1007-9327/full/v11/i22/3485.htm
- DOI: https://dx.doi.org/10.3748/wjg.v11.i22.3485


