Copyright
©2005 Baishideng Publishing Group Inc.
World J Gastroenterol. Jun 14, 2005; 11(22): 3468-3472
Published online Jun 14, 2005. doi: 10.3748/wjg.v11.i22.3468
Published online Jun 14, 2005. doi: 10.3748/wjg.v11.i22.3468
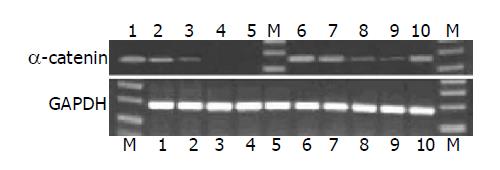
Figure 1 RT-PCR analysis of α-catenin mRNA in gastric tissues.
Amplification of GAPDH mRNA was performed to ensure equal loading. Lanes 1 and 10: healthy controls; lane 6: tumor free; lanes 2-5, 7-9: tumor; M: marker.
Figure 2 Immunoreactivity of α-catenin in gastric carcinoma.
A: Normal membranous staining pattern (SP ×400). B: Poorly differentiated tumors with complete loss of membranous staining in the majority of cells. Membranous staining can be seen in a few cells retaining gastric gland (SP ×200). C: Moderately differentiated tumors showing membranous staining pattern (SP ×200).
- Citation: Zhou YN, Xu CP, Chen Y, Han B, Yang SM, Fang DC. α-catenin expression is decreased in patients with gastric carcinoma. World J Gastroenterol 2005; 11(22): 3468-3472
- URL: https://www.wjgnet.com/1007-9327/full/v11/i22/3468.htm
- DOI: https://dx.doi.org/10.3748/wjg.v11.i22.3468


