Copyright
©2005 Baishideng Publishing Group Inc.
World J Gastroenterol. Jun 14, 2005; 11(22): 3465-3467
Published online Jun 14, 2005. doi: 10.3748/wjg.v11.i22.3465
Published online Jun 14, 2005. doi: 10.3748/wjg.v11.i22.3465
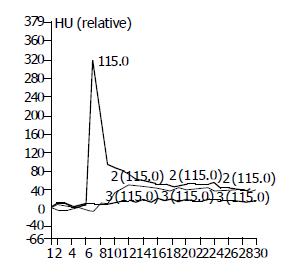
Figure 1 Time-density curves for abdominal aorta (curve 1), portal vein (curve 2) and liver parenchyma (curve 3).
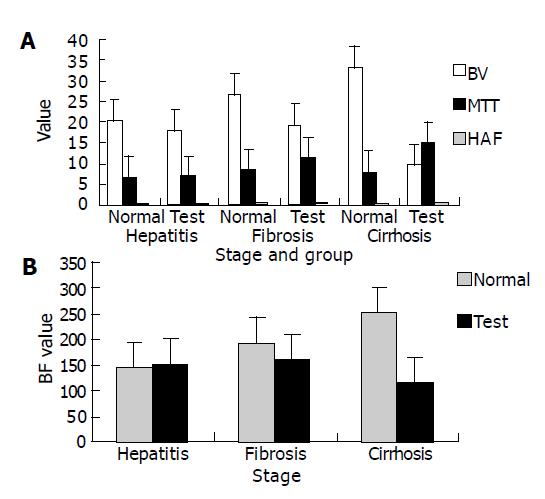
Figure 2 Histogram of BV, MTT, HAF (A) and BF (B) at different stages in two groups.
- Citation: Guan S, Zhao WD, Zhou KR, Peng WJ, Mao J, Tang F. CT perfusion at early stage of hepatic diffuse disease. World J Gastroenterol 2005; 11(22): 3465-3467
- URL: https://www.wjgnet.com/1007-9327/full/v11/i22/3465.htm
- DOI: https://dx.doi.org/10.3748/wjg.v11.i22.3465


