Copyright
©2005 Baishideng Publishing Group Inc.
World J Gastroenterol. Jun 14, 2005; 11(22): 3368-3374
Published online Jun 14, 2005. doi: 10.3748/wjg.v11.i22.3368
Published online Jun 14, 2005. doi: 10.3748/wjg.v11.i22.3368
Figure 1 Chemical structure of EGCG.
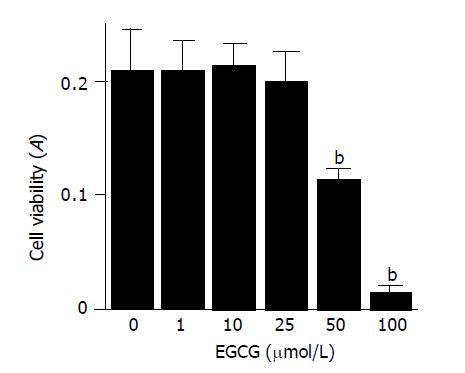
Figure 2 EGCG was cytotoxic at higher concentrations.
PSCs were treated with EGCG at the indicated concentrations (μmol/L) in serum-free medium for 72 h. Cell viability was determined by the MTT assay, and the absorbance at 570-690 nm (“A”) of the sample is shown. Data are shown as mean±SD (n = 6). bP<0.01 vs EGCG at 0 μmol/L. A: optical density.
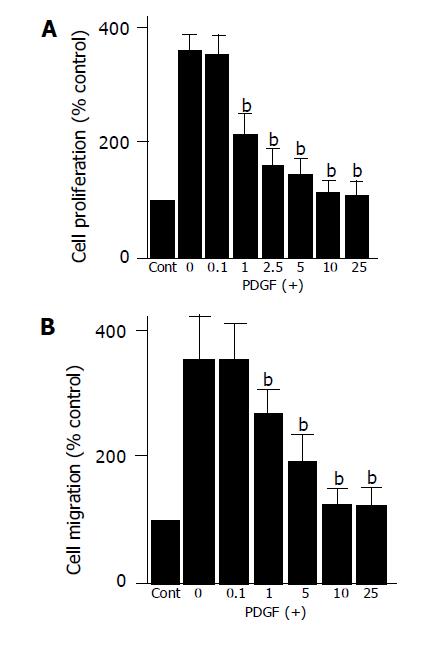
Figure 3 EGCG inhibited PDGF-induced proliferation and migration.
A: Serum-starved PSCs were left untreated (“Cont”) or treated with PDGF-BB (at 25 μg/L) in the presence or absence of EGCG at the indicated concentrations (μmol/L). After 24-h incubation, DNA synthesis was assessed by BrdU incorporation enzyme-linked immunosorbent assay. Data are shown as mean±SD (% of the control, n = 6). bP<0.01 vs PDGF only; B: cell migration was assessed using modified Boyden chambers with 8-μm pore filters. Serum-starved PSCs were left untreated (“Cont”) or were treated with PDGF-BB (at 25 μg/L) in the lower chamber in the absence or presence of EGCG at the indicated concentrations (μmol/L). After 24-h incubation with PDGF, the cells migrated to the underside of the filter were stained, and counted. Data are shown as mean±SD (% of the control, n = 6). bP<0.01 vs PDGF only.
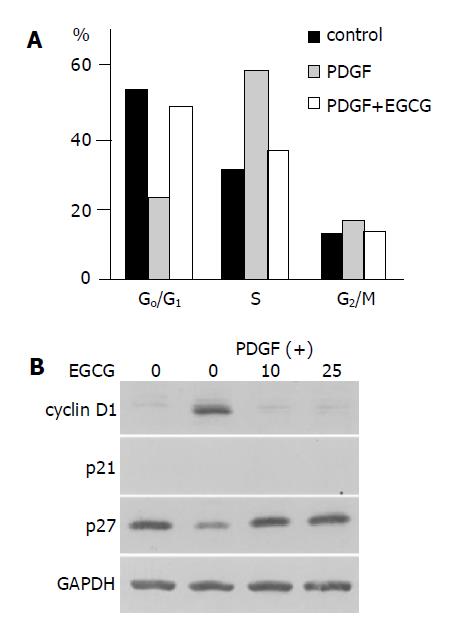
Figure 4 EGCG inhibited cell cycle progression beyond G1 phase.
A: PSCs were treated with PDGF-BB (at 25 μg/L) in the absence or presence of EGCG at 25 μmol/L. After 24-h incubation, cells were harvested, and cell cycle analysis was performed by flow cytometry after staining with propidium iodide. Data show the percentage of cells in each phase of the cell cycle in a representative experiment; B: PSCs were treated with PDGF-BB (at 25 μg/L) in the absence or presence of EGCG at the indicated concentrations (μmol/L). After 24-h incubation, cells were harvested, and total cell lysates were prepared. The levels of cyclin D1, p21Waf1, p27Kip1, and GAPDH were determined by Western blotting.
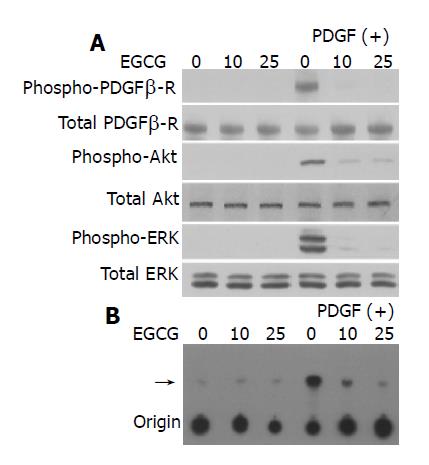
Figure 5 EGCG inhibited phosphorylation of PDGF β-receptor, ERK, and Akt.
PSCs were incubated in the absence or presence of EGCG at the indicated concentrations for 1 h, and then treated with PDGF-BB (at 25 μg/L) for 5 min. A: total cell lysates were prepared, and the total and phosphorylated levels of PDGF β-receptor, Akt, and ERK were determined by Western blotting; B: total cell lysates were prepared and immunoprecipitated with anti-phosphotyrosine antibody. PI3-kinase activity was assessed using PI as a substrate. The arrow denotes the product, PI3-phosphate, resolved by thin layer chromatography.
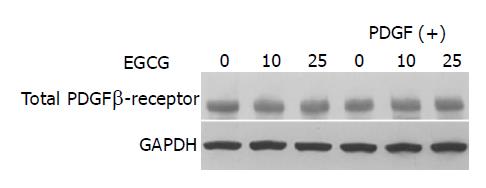
Figure 6 EGCG did not alter the expression of total PDGF β-receptor.
PSCs were incubated with EGCG at the indicated concentrations in the absence or presence of PDGF-BB (at 25 μg/L). After 24 h, total cell lysates (approximately 100 μg) were prepared, and the levels of total PDGF β-receptor and GAPDH were determined by Western blotting.
- Citation: Masamune A, Kikuta K, Satoh M, Suzuki N, Shimosegawa T. Green tea polyphenol epigallocatechin-3-gallate blocks PDGF-induced proliferation and migration of rat pancreatic stellate cells. World J Gastroenterol 2005; 11(22): 3368-3374
- URL: https://www.wjgnet.com/1007-9327/full/v11/i22/3368.htm
- DOI: https://dx.doi.org/10.3748/wjg.v11.i22.3368


