Copyright
©2005 Baishideng Publishing Group Inc.
World J Gastroenterol. Jun 14, 2005; 11(22): 3335-3338
Published online Jun 14, 2005. doi: 10.3748/wjg.v11.i22.3335
Published online Jun 14, 2005. doi: 10.3748/wjg.v11.i22.3335
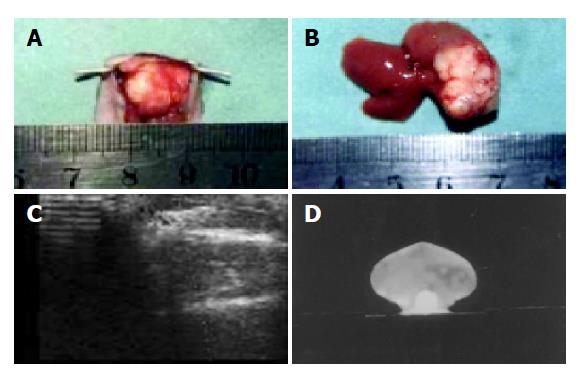
Figure 1 The specimen and images by Doppler and CT.
A: Specimen of tumor model after 15 d of implantation; B: specimen of tumor model after 25 d of implantation; C: color Doppler image of tumor model after 25 d of implantation; D: contrast-enhanced abdominal CT image of tumor model after 20 d of implantation.
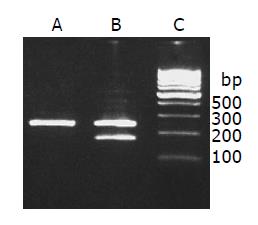
Figure 2 Mdr1 mRNA expression.
lane A: Control group; lane B: induced group; lane C: 100-bp marker.
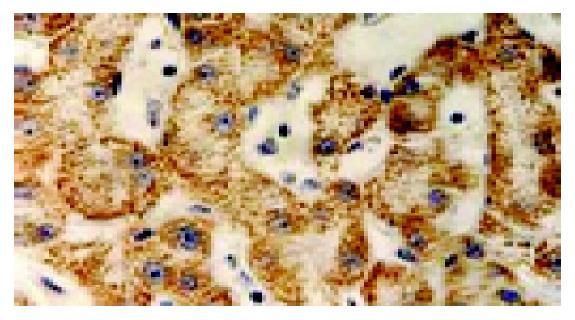
Figure 3 Expression of p-gp by using immunohistochemistry (SABC ×200).
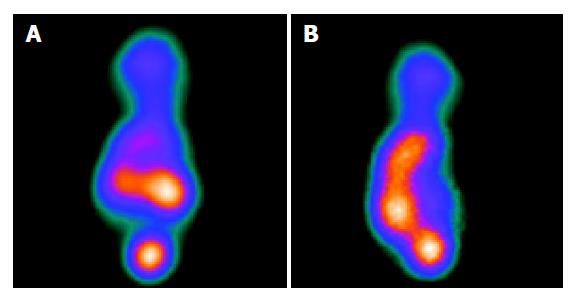
Figure 4 SPECT images of the nude mice model.
A: SPECT of control group showing dense radioactivity; B: SPECT of control group showing deficiency radioactivity.
- Citation: Han Y, Chen XP, Huang ZY, Zhu H. Nude mice multi-drug resistance model of orthotopic transplantation of liver neoplasm and Tc-99m MIBI SPECT on p-glycoprotein. World J Gastroenterol 2005; 11(22): 3335-3338
- URL: https://www.wjgnet.com/1007-9327/full/v11/i22/3335.htm
- DOI: https://dx.doi.org/10.3748/wjg.v11.i22.3335


