Copyright
©2005 Baishideng Publishing Group Inc.
World J Gastroenterol. May 7, 2005; 11(17): 2616-2625
Published online May 7, 2005. doi: 10.3748/wjg.v11.i17.2616
Published online May 7, 2005. doi: 10.3748/wjg.v11.i17.2616
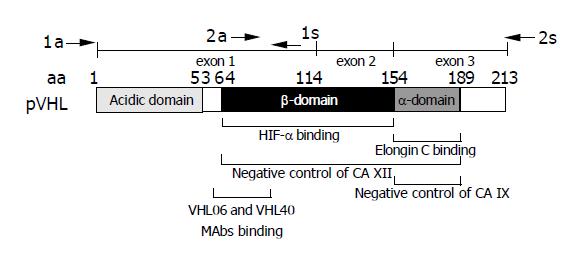
Figure 1 Schematic drawing of pVHL domain composition.
Epitope region for the monoclonal antibodies VHL06 and VHL40 used in immunohistochemistry is shown below the scheme[30]. Positions of primers (a = antisense, s = sense) used for the amplification of two overlapping RT-PCR products are indicated above the exon map. Involvement of HIF-α-binding β-domain and elongin C-binding α-domain of pVHL in the negative regulation of CA XII and CA IX is illustrated according to data described by Ivanov et al[6].
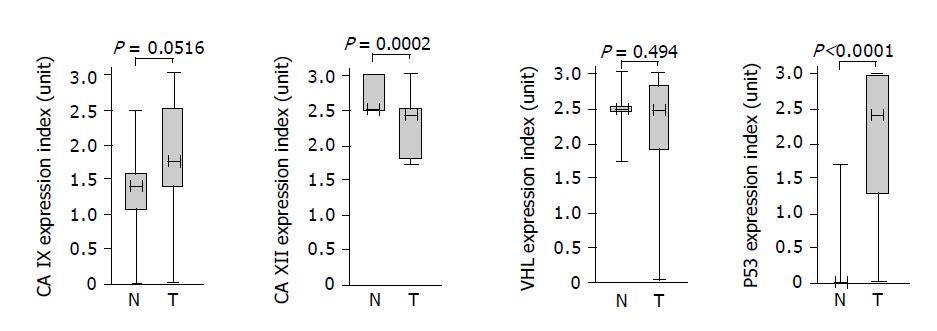
Figure 2 Associations of the proteins with colorectal tumors based on semi-quantitative immunohistochemical assessment and analysis of the data using the Mann-Whitney rank test.
Each box indicates the range of staining indices from the 25% to the 75% quantile, the horizontal line denotes the median and the whiskers above and below the box show the highest and lowest index. Values of significance are given above the graphs.
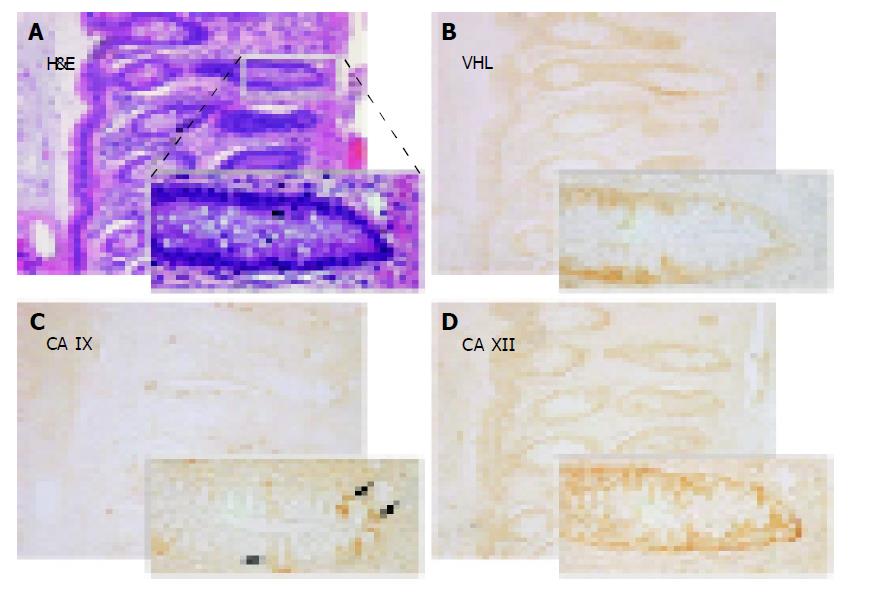
Figure 3 Immunohistochemical detection of pVHL (B), CA IX (C) and CA XII (D) in serial sections from the normal colon with details shown on magnified areas in the left corners.
Arrows in panel C designate a focal membrane signal specific for CA IX. A shows hematoxylin-eosin (H&E) staining of a parallel section. Original magnification, ×100.
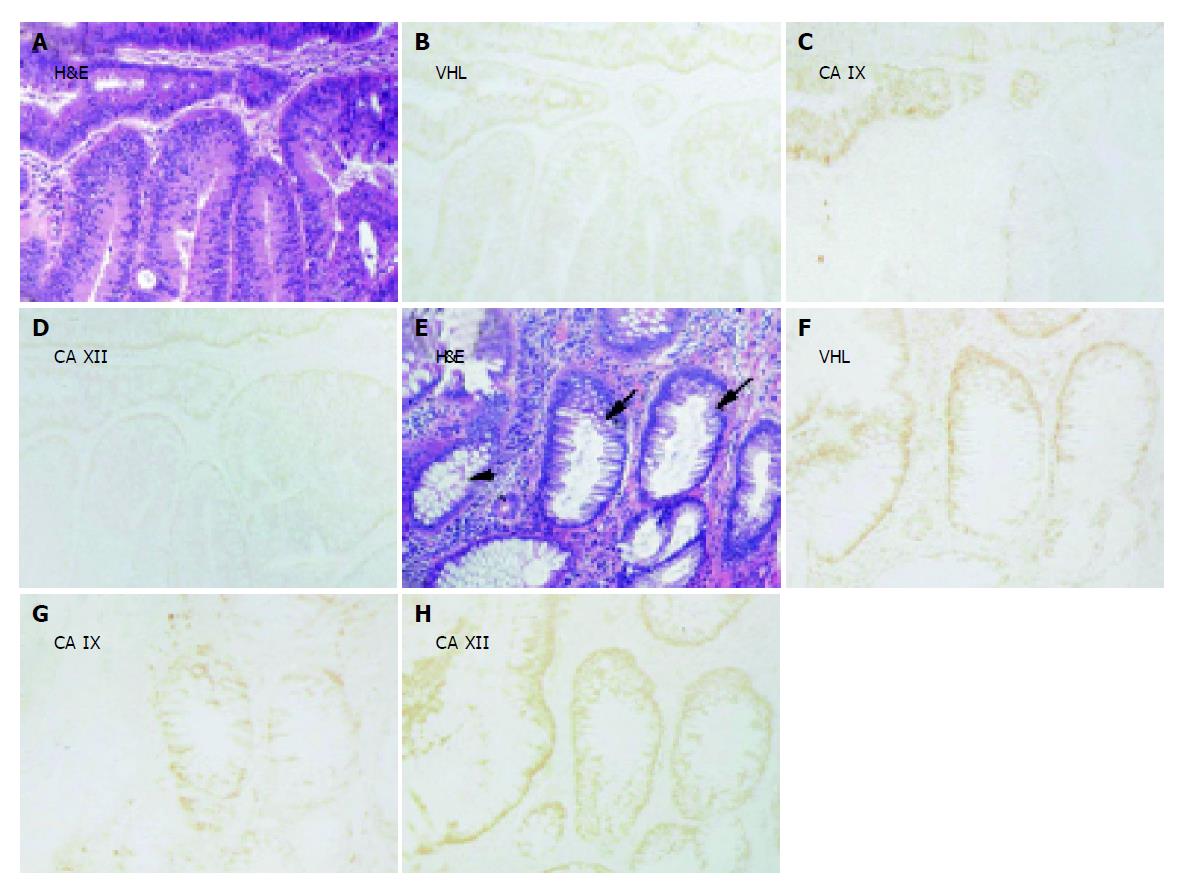
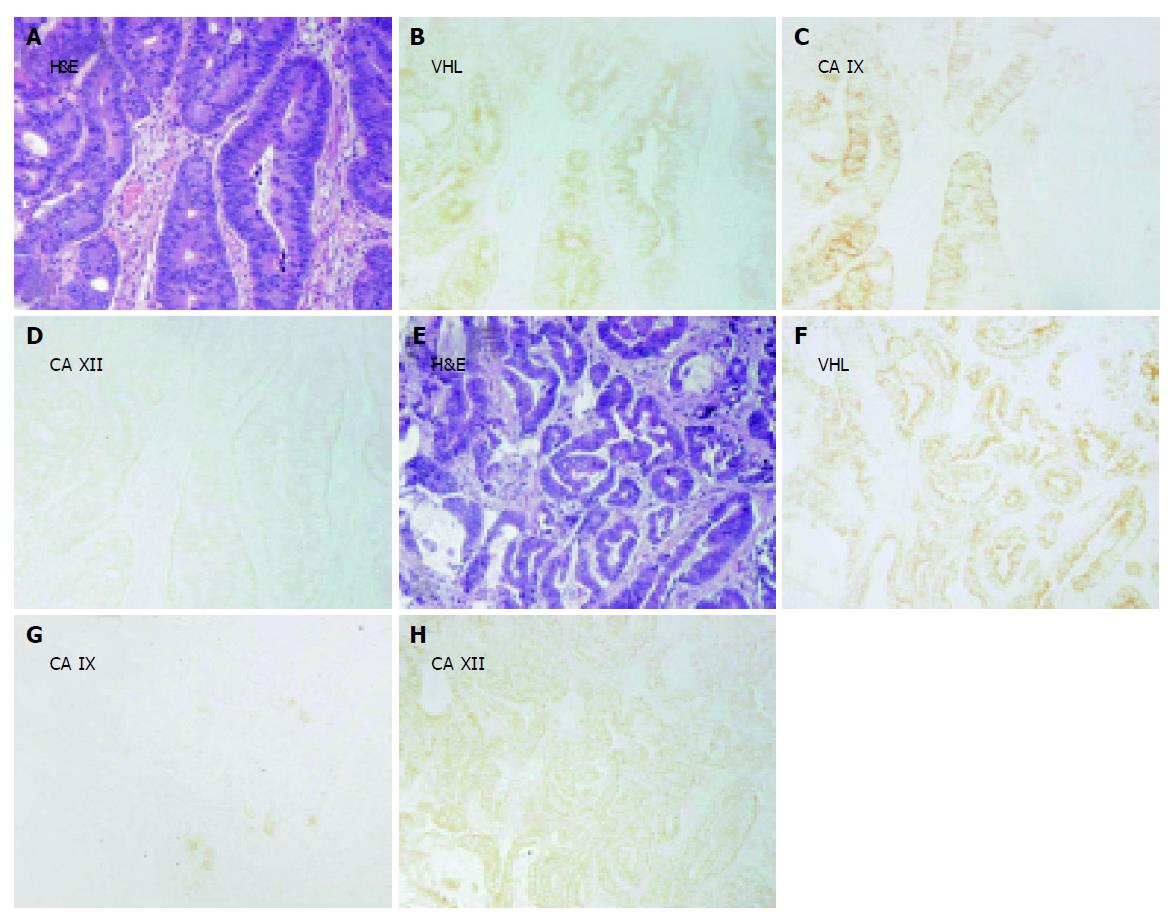
Figure 4 Immunohistochemical staining of pVHL, CA IX and CA XII in parallel sections of (B-D) moderate (lower part) and grave (upper part) adenomas and of (F-H) transitional epithelium (small arrows) located between histologically normal region (arrowhead) and grade I adenocarcinoma (not shown).
Corresponding H&E staining is shown in panels A and E. Original magnifications, ×100.
Figure 5 Examples of immunohistochemical staining of pVHL, CA IX and CA XII in parallel sections of adenocarcinoma (grade II) with (A-D) or without (E-H) mucinous component.
One crypt remains negative for CA IX (C). Corresponding H&E staining is shown in panels A and E. Original magnifications, ×100.
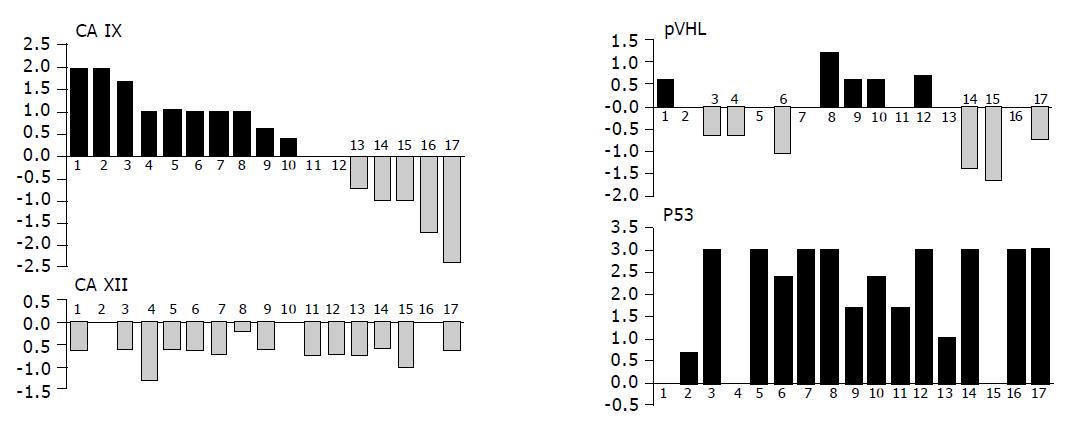
Figure 6 Graphical illustration of the tumor-associated differences in expression of pVHL, CA IX, CA XII and p53 in individual patients analyzed by immunohistochemistry (the same person is designated by the same number in all graphs).
Values of staining indices obtained in normal tissues were subtracted from those obtained in corresponding pathological lesions from the same person (mean value was used when more tumor specimens were available from one patient). Resulting data were shown in histograms on compatible scales demonstrating the range of differences related to each marker and allowing for their visual comparisons. There were no relationships found between the studied proteins.
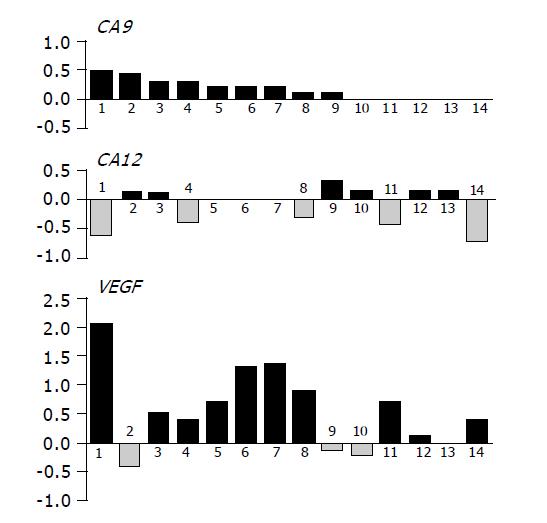
Figure 7 Graphical illustration of the tumor-associated differences in mRNA levels of CA9, CA12 and VEGF in individual patients analyzed by RT-PCR.
Values representing relative amounts of mRNAs expressed in normal tissues were subtracted from those obtained in paired pathological lesions. Resulting data were drawn in histograms on compatible scales allowing for their comparisons. Highly significant inverse relationship was found between CA12 and VEGF by χ2 analysis (P = 0.0063).
- Citation: Kivela AJ, Parkkila S, Saarnio J, Karttunen TJ, Kivela J, Parkkila AK, Bartosova M, Mucha V, Novak M, Waheed A, Sly WS, Rajaniemi H, Pastorekova S, Pastorek J. Expression of von Hippel-Lindau tumor suppressor and tumor-associated carbonic anhydrases IX and XII in normal and neoplastic colorectal mucosa. World J Gastroenterol 2005; 11(17): 2616-2625
- URL: https://www.wjgnet.com/1007-9327/full/v11/i17/2616.htm
- DOI: https://dx.doi.org/10.3748/wjg.v11.i17.2616


