Copyright
©2005 Baishideng Publishing Group Inc.
World J Gastroenterol. Apr 21, 2005; 11(15): 2277-2282
Published online Apr 21, 2005. doi: 10.3748/wjg.v11.i15.2277
Published online Apr 21, 2005. doi: 10.3748/wjg.v11.i15.2277
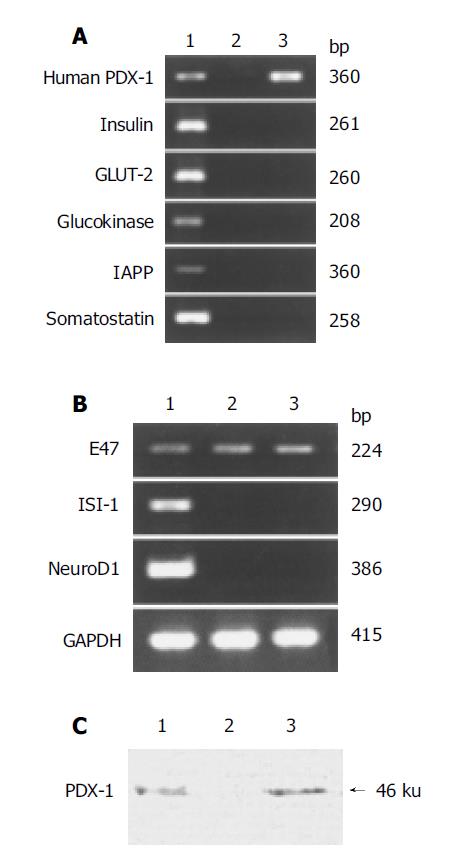
Figure 1 Expression of PDX-1 transgene and other islet-enriched genes in PDX-1+HepG2 cell line.
RT-PCR analysis was performed to detect the expression of several islet differentiation markers (A) and islet-specific transcriptional factors (B). GAPDH mRNA was amplified as an internal control. Western blot analysis was performed to detect the expression of PDX-1 using anti-PDX-1 antibody on total protein lysis (C). Lane 1: 24-wk human fetal pancreas (positive control); Lane 2: wild type HepG2 cells (negative control); Lane 3: PDX-1+HepG2 cells. Data are representative of at least three independent experiments.
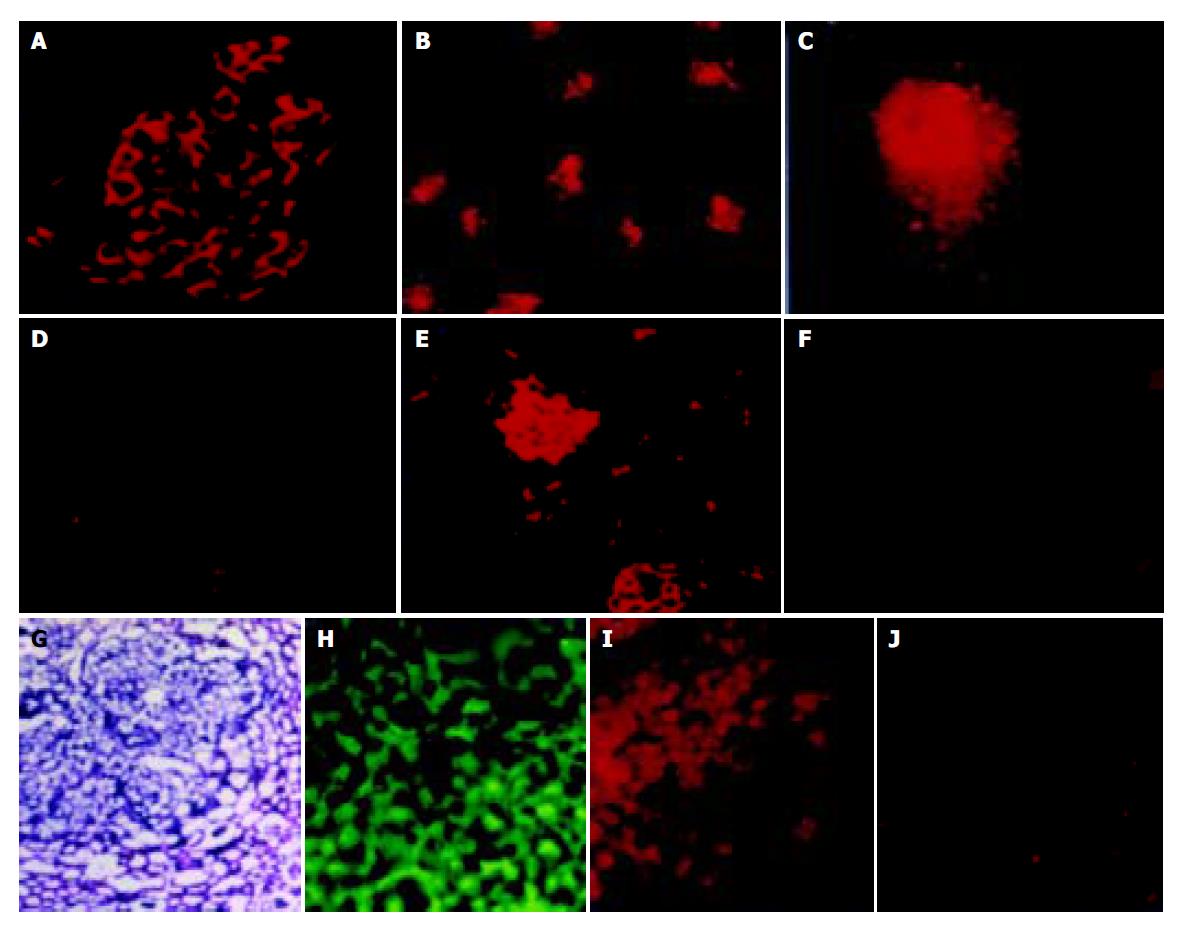
Figure 2 In situ immunostaining analysis of PDX-1+HepG2 cells in culture and after transplantation into nude mice.
Representatives are shown (original magnification 200×, unless otherwise stated). Anti-PDX-1 fluorescence stains cultured PDX-1+HepG2 cells (B), compared to 24-wk human fetal pancreatic islets (A). The ectopically expressed PDX-1 protein locates mainly within nuclear region (C, 400×). Parental HepG2 cells serve as a negative control (D). Anti-insulin fluorescence immunostaining indicates positive staining in human islet positive control (E) but not in PDX-1+HepG2 cells (F). H&E staining reveals implanted PDX-1+HepG2 cells in section of kidney (G, 100×), indicating that these cells infiltrated into nephric tissues and underwent proliferation. Anti-human nuclei antibody staining confirmed that these cells were of human origin (H, green cells). Anti-PDX-1 staining of mice kidney sections showed consistent expression of PDX-1 transgene in these implanted PDX-1+HepG2 cells (I), but insulin expression was absent (J).
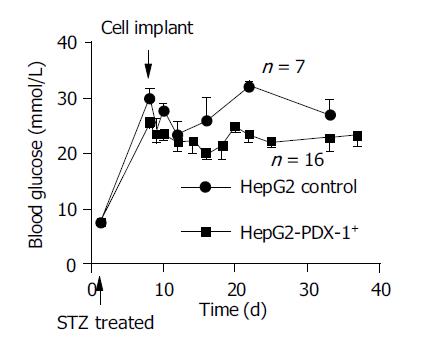
Figure 3 Blood glucose level of STZ-induced diabetic nude mice after implantation of PDX-1+ HepG2 cells under renal capsule.
Between 5×10⁶ and 1×10⁷ PDX-1+HepG2 cells or parental HepG2 cells were injected into subcapsular space. Blood glucose level was measured 0, 1, 2, 3, 5, 7, 9, 11, 13, 15, 18, 26, 30 d after operation. Values are expressed as mean±SD for each time point, PDX-1+HepG2 group (n = 16) vs HepG2 group (n = 7).
- Citation: Lu S, Wang WP, Wang XF, Zheng ZM, Chen P, Ma KT, Zhou CY. Heterogeneity in predisposition of hepatic cells to be induced into pancreatic endocrine cells by PDX-1. World J Gastroenterol 2005; 11(15): 2277-2282
- URL: https://www.wjgnet.com/1007-9327/full/v11/i15/2277.htm
- DOI: https://dx.doi.org/10.3748/wjg.v11.i15.2277


