Copyright
©2005 Baishideng Publishing Group Inc.
World J Gastroenterol. Mar 21, 2005; 11(11): 1605-1609
Published online Mar 21, 2005. doi: 10.3748/wjg.v11.i11.1605
Published online Mar 21, 2005. doi: 10.3748/wjg.v11.i11.1605
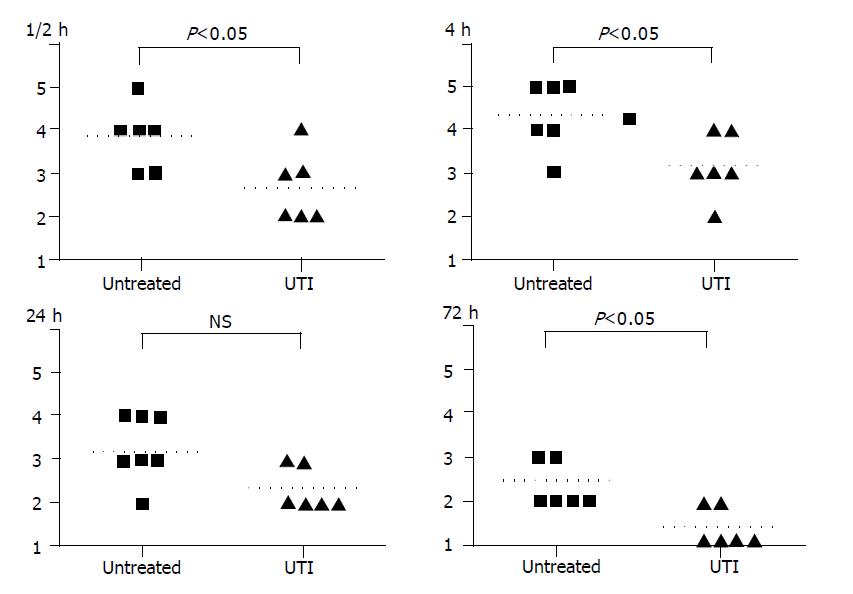
Figure 1 At 1.
5, 4, 24, and 72 h after intestinal transplantation, the histological scores of tissue injury in the UTI-treated group were apparently less than the untreated group.
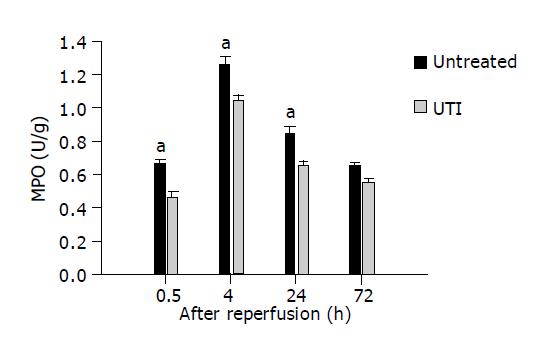
Figure 2 MPO activity in the intestinal grafts in the UTI-treated group remained at a lower level when compared with the control group in the earlier time points after IR (1.
5, 4, and 24 h after transplantation respectively, aP<0.05 vs control group).
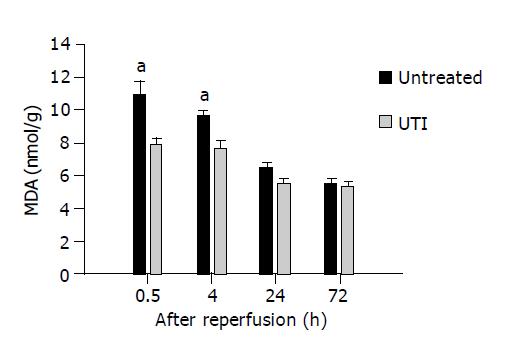
Figure 3 The MDA level at 1.
5 and 4 h after transplantation was significantly suppressed in UTI-treated group, aP<0.05 vs the untreated control group.
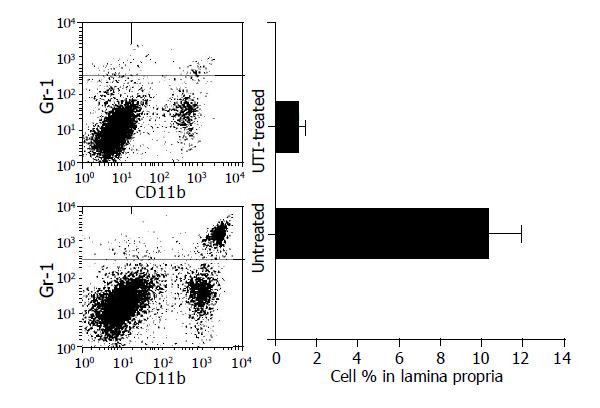
Figure 4 The sub-population of CD11b+ Gr1+ cells in the monocyte gate of graft lamina propria was found reduced in the UTI-treated group on the third post-transplant day.
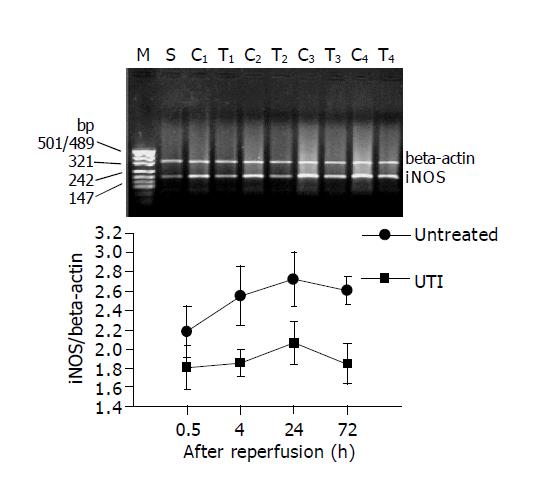
Figure 5 In UTI group, the expression of i-NOS mRNA was apparently inhibited at 1.
5, 4, 24, and 72 h after intestinal transplantation. The upper bands show the representative images of the PT-PCR results for i-NOS. M: band for molecular marker; S: Sham operation group; C1-C4: bands for untreated group at 1.5, 4, 24 and 72 h after transplantation respectively; T1-T4: bands for UTI-treated group at 1.5, 4, 24 and 72 h after transplantation, respectively.
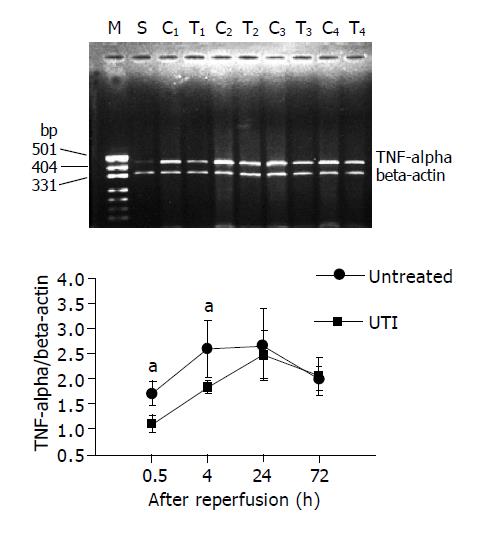
Figure 6 The expression of TNFα mRNA was inhibited at 1.
5 and 4 h after intestinal transplantation in UTI-treated group, while no difference was found at 24 and 72 h after transplantation. The upper bands show the representative images of the PT-PCR results for TNFα. M: band for molecular marker; S: Sham operation group; C1-C4: bands for untreated group at 1.5, 4, 24 and 72 h after transplantation respectively; T1-T4: bands for UTI-treated group at 1.5, 4, 24 and 72 h after transplantation, respectively.
- Citation: Yu JR, Yan S, Liu XS, Wu YJ, Fu PF, Wu LH, Zheng SS. Attenuation of graft ischemia-reperfusion injury by urinary trypsin inhibitor in mouse intestinal transplantation. World J Gastroenterol 2005; 11(11): 1605-1609
- URL: https://www.wjgnet.com/1007-9327/full/v11/i11/1605.htm
- DOI: https://dx.doi.org/10.3748/wjg.v11.i11.1605


