Copyright
©2005 Baishideng Publishing Group Inc.
World J Gastroenterol. Mar 14, 2005; 11(10): 1508-1514
Published online Mar 14, 2005. doi: 10.3748/wjg.v11.i10.1508
Published online Mar 14, 2005. doi: 10.3748/wjg.v11.i10.1508
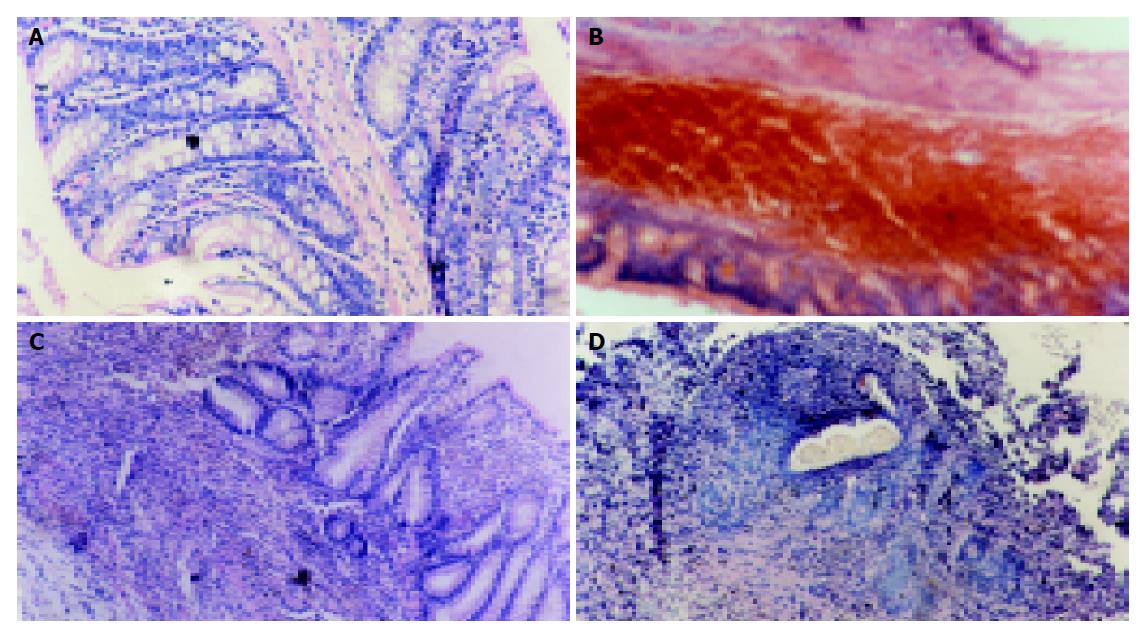
Figure 1 Changes of histological morphology in NS or T/E group.
A: No damage in NS group, HE×200; B: Erosion, hemorrhage, edema, and ulceration at mucous and submucous layers at 24 h time point. HE×100; C: Ulcer at 14 d, HE×100; D: Granuloma-like structures and inflammatory cells in submucosa at 14 d, HE×100.
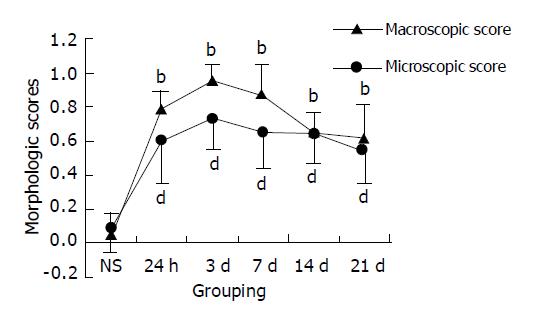
Figure 2 Changes of morphologic scores at various time points.
bP<0.01 vs macroscopic score in NS group. dP<0.01 vs microscopic score in NS group.
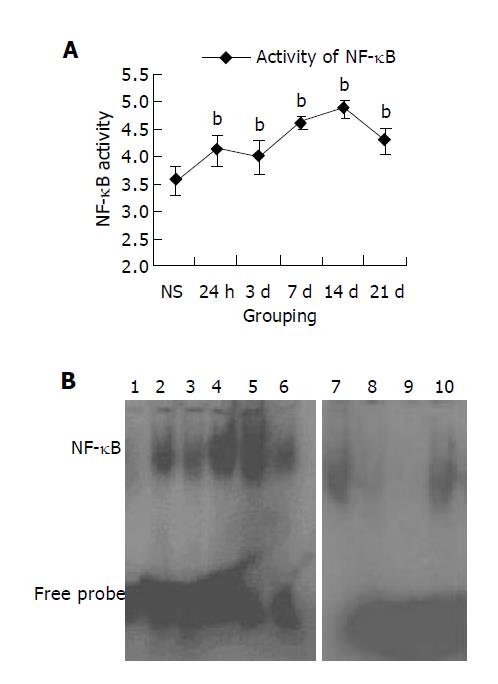
Figure 3 NF-κB activity of colonic tissue in various groups.
A: The binding activity of NF-κB increased with inflammation progression. bP<0.01 vs NF-κB activity in NS group; B:The image of EMSA in various group and competition test. lanes 1-6: NF-κB activity in NS, 21 h, 3 d, 7 d, 14 d, and 21 d groups. lane 7: with the labeled probe. lanes 8-9: specific competition experiment with 50, 100 fold excess of unlabeled probe. lane 10: nonspecific competition experiment with AP2 probe.
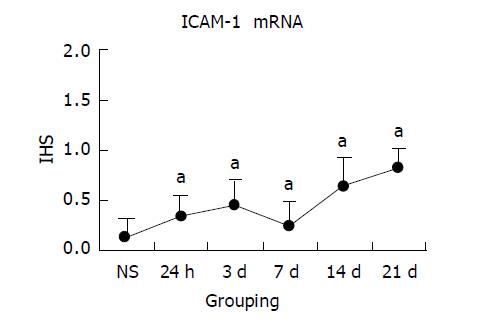
Figure 4 ICAM-1 mRNA expression of colonic tissue in various groups.
aP<0.05 vs IHS in NS group.
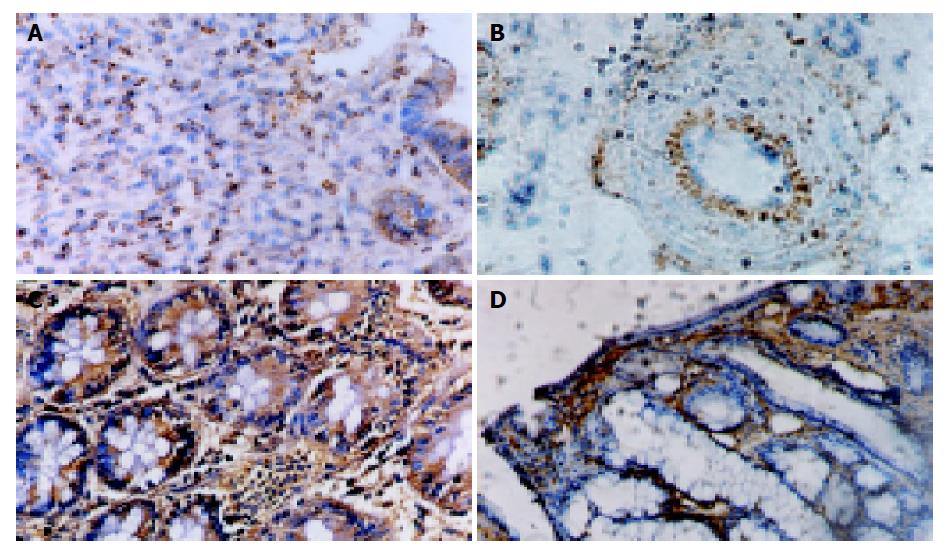
Figure 5 Expression of ICAM-1 mRNA and protein in colonic tissues.
A: ICAM-1 mRNA expressed in inflammatory cells at submucosa, ISH×400; B: ICAM-1 mRNA expressed in arterial endothelial cells in submucosa, ISH×400; C: ICAM-1 expressed in epithelial cells in mucosa near inflammatory region, SABC×400; D: ICAM-1 expressed in lamina propria, SABC×200.
Figure 6 Changes of histological score, MPO activity, and MDA level in various group.
A: Histological score. aP<0.05 vs histological score in M group. bP<0.01 vs histological score in M group; B: MPO activity. cP<0.05 vs MPO activity in M group; C: MDA level. dP<0.01 vs MDA level in M group.
Figure 7 Changes of histological morphology in M, P10, P100 groups.
A: The changes of histology in M group. HE×200; B: The changes of histology with PDTC 10 mg/kg. HE×200; C: The changes of histology with PDTC 100 mg/kg. HE×200.
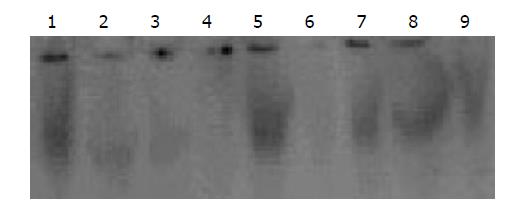
Figure 8 The image of EMSA in various groups and competition test.
lanes 1-3: specific competition experiment. lanes 4-9: activity of NF-κB DNA-Binding in N, M, P10, P25, P100 groups.
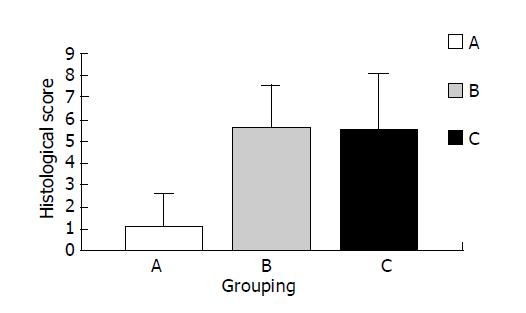
Figure 9 Changes of histological morphology in groups A, B, C.
A: enema with normal saline and normal saline given i.p. every 48 h starting from d 1. B: enema with TNBS/ethanol and normal saline given i.p. starting from d 1. C: enema with TNBS/ethanol and PDTC given (100 mg/kg) i.p. starting from d 1.
- Citation: Chen K, Long YM, Wang H, Lan L, Lin ZH. Activation of nuclear factor-kappa B and effects of pyrrolidine dithiocarbamate on TNBS-induced rat colitis. World J Gastroenterol 2005; 11(10): 1508-1514
- URL: https://www.wjgnet.com/1007-9327/full/v11/i10/1508.htm
- DOI: https://dx.doi.org/10.3748/wjg.v11.i10.1508


