Copyright
©2005 Baishideng Publishing Group Inc.
World J Gastroenterol. Mar 14, 2005; 11(10): 1496-1502
Published online Mar 14, 2005. doi: 10.3748/wjg.v11.i10.1496
Published online Mar 14, 2005. doi: 10.3748/wjg.v11.i10.1496
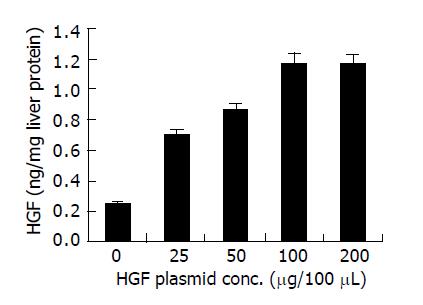
Figure 1 ELISA of human HGF protein concentrations in extracts of liver tissue taken from electroporated area 2 d after EGT-HGF.
Figure 2 Apoptotic activities (TUNEL analysis) in rat liver after 65 Gy of irradiation.
A: EGT-control vector 2 d before liver irradiation; B: EGT-HGF 2 d before irradiation. Rats were sacrificed 2 d after irradiation and stained with TUNEL assay. Note the brown round stain indicated TUNEL-positive cells, which gathered around microvascular region. EGT-HGF almost completely protected rat liver from radiation-induced apoptosis; C: Percent of apoptotic cells were quantitated per 100 μm2 in areas shown on A and B. (P<0.05).
Figure 3 Histopathology of the liver 10 wk after 65 Gy of irradiation.
A: rat liver (×200) receiving EGT-control-vector followed by 65 Gy of liver radiation 48 h later; B: rat liver (×200) receiving EGT-HGF followed by 65 Gy of liver radiation 48 h later. The blue stain indicated fibrosis formation. Fibrosis is more extensive with evidence of bile duct proliferation, sub-intimal thickening of arterioles with compromise of the vessel lumens. The morphology changes were less severe in HGF gene therapy group.
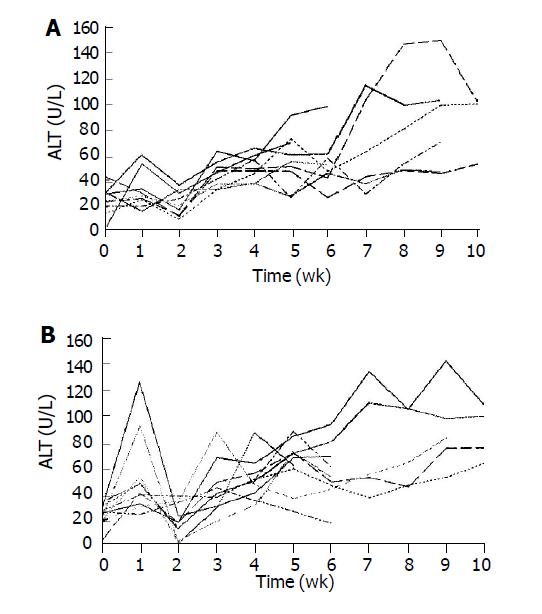
Figure 4 Weekly plasma ALT changes in rats receiving whole liver irradiation.
A: Serial plasma ALT changes in EGT-HGF plus radiation group; B: Serial plasma ALT changes in EGT-control vector plus radiation group.
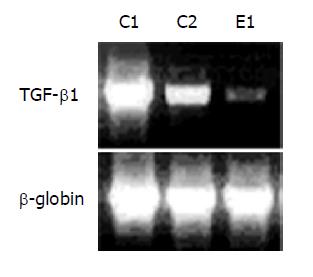
Figure 5 TGF-β1 RT-PCR analysis 2 d after liver irradiation.
C1: rats receiving EGT-control vector and 65 Gy of liver irradiation; C2: rats receiving EGT-control vector and 20 Gy of liver irradiation; E1: rats receiving EGT-HGF and 65 Gy of liver irradiation. Figure is the representative of 3 experiments.
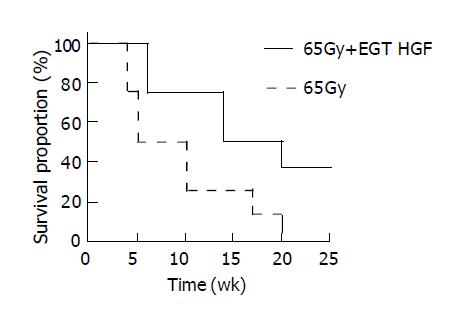
Figure 6 Survival analyses of rats after whole liver irradiation of 65 Gy.
Segmented line (n = 8) indicated group that received EGT-control vector plus radiation treatment. Solid line (n = 8) indicated group that received EGT-HGF plus radiation treatment.
- Citation: Chi CH, Liu IL, Lo WY, Liaw BS, Wang YS, Chi KH. Hepatocyte growth factor gene therapy prevents radiation-induced liver damage. World J Gastroenterol 2005; 11(10): 1496-1502
- URL: https://www.wjgnet.com/1007-9327/full/v11/i10/1496.htm
- DOI: https://dx.doi.org/10.3748/wjg.v11.i10.1496


