Copyright
©2005 Baishideng Publishing Group Inc.
World J Gastroenterol. Mar 14, 2005; 11(10): 1420-1425
Published online Mar 14, 2005. doi: 10.3748/wjg.v11.i10.1420
Published online Mar 14, 2005. doi: 10.3748/wjg.v11.i10.1420
Figure 1 Proliferation assays showing cell numbers from mean counts of three experiments.
Cells were treated as described in Materials and Methods with sirolimus, tacrolimus, or the combination of both. Sir = sirolimus; Tac = tacrolimus. Data are expressed as mean±SE. (A: SK-Hep 1: aP = 0.0105; bP = 0.0156; cP = 0.254; dP<0.0001; B: Hep 3B: eP<0.0001; fP = 0.0654; gP = 0.0002; hP<0.0001).
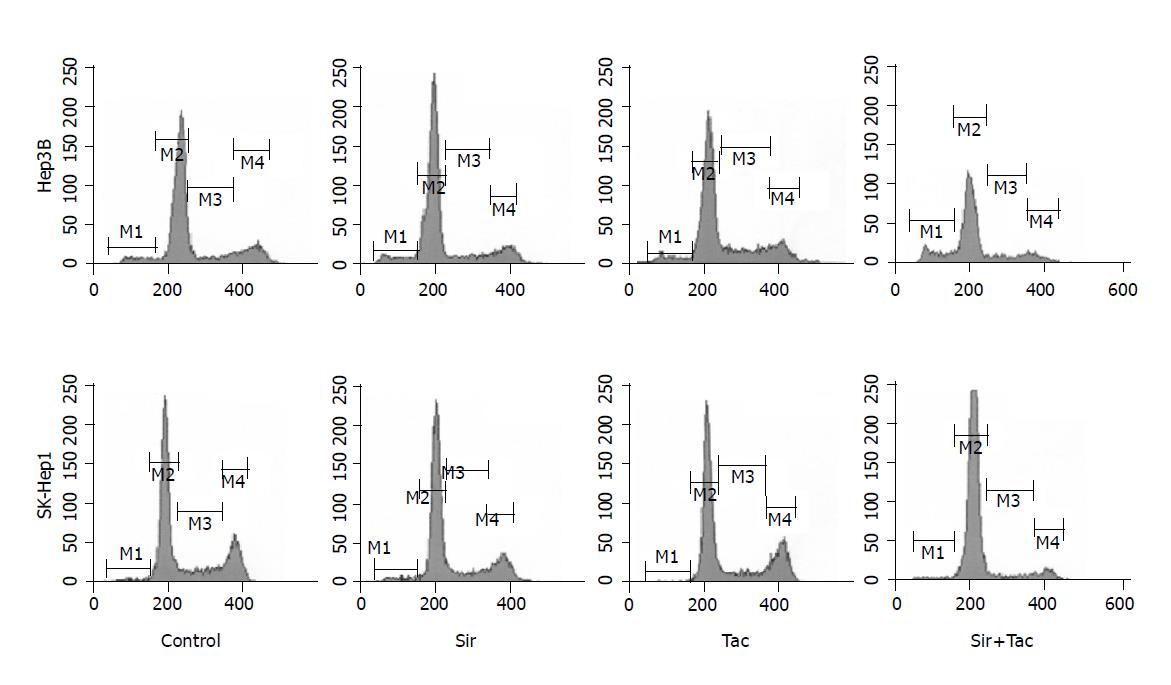
Figure 2 Cell-cycle analysis of both cell lines after treatment for 24 h with sirolimus, tacrolimus, or the combination of both at a dose of 25 ng/mL each compound.
M1 = Sub-G1 region, indicating cells with small DNA fragments, a typical feature of apoptosis; M2 = G1-Phase; M3 = S-Phase; M4 = G2/M-Phase. The different cell cycle phases (M1-M4) were set in a reference analysis and kept constant throughout the measurements.
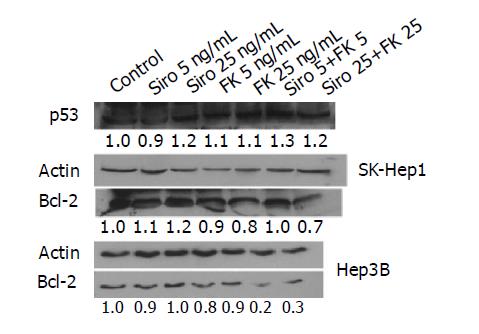
Figure 3 Western blot analysis of p53 and bcl-2.
SK-Hep 1 cells express wild-type p53. Hep 3B cells harbor a deletion of the p53 gene and express no p53 protein. Expression levels were analyzed by densitometry referring to levels of actin. Relative values to controls are shown.
- Citation: Schumacher G, Oidtmann M, Rueggeberg A, Jacob D, Jonas S, Langrehr JM, Neuhaus R, Bahra M, Neuhaus P. Sirolimus inhibits growth of human hepatoma cells alone or combined with tacrolimus, while tacrolimus promotes cell growth. World J Gastroenterol 2005; 11(10): 1420-1425
- URL: https://www.wjgnet.com/1007-9327/full/v11/i10/1420.htm
- DOI: https://dx.doi.org/10.3748/wjg.v11.i10.1420


