Copyright
©2005 Baishideng Publishing Group Inc.
World J Gastroenterol. Mar 14, 2005; 11(10): 1411-1419
Published online Mar 14, 2005. doi: 10.3748/wjg.v11.i10.1411
Published online Mar 14, 2005. doi: 10.3748/wjg.v11.i10.1411
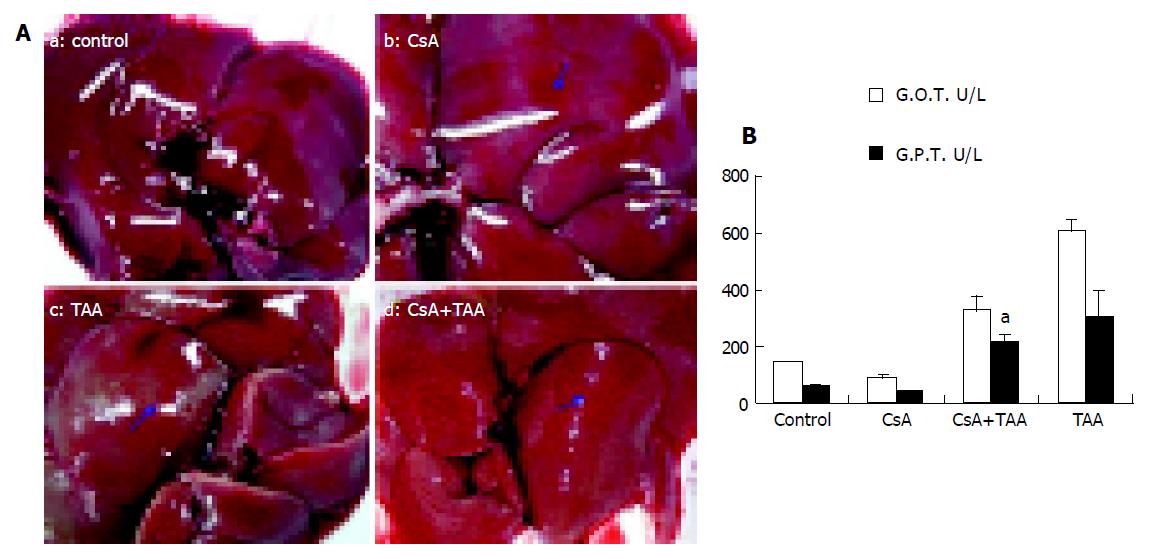
Figure 1 (A) morphology of liver, and the (B) alterations of blood GOT/GPT in (a) control, (b) CsA treatment, (c) TAA-induced, (d) CsA plus TAA treatment rats.
The regimens of CsA, TAA or CsA plus TAA treatment were as described in Materials and Methods. aP<0.05 between TAA and TAA plus CsA treatments.
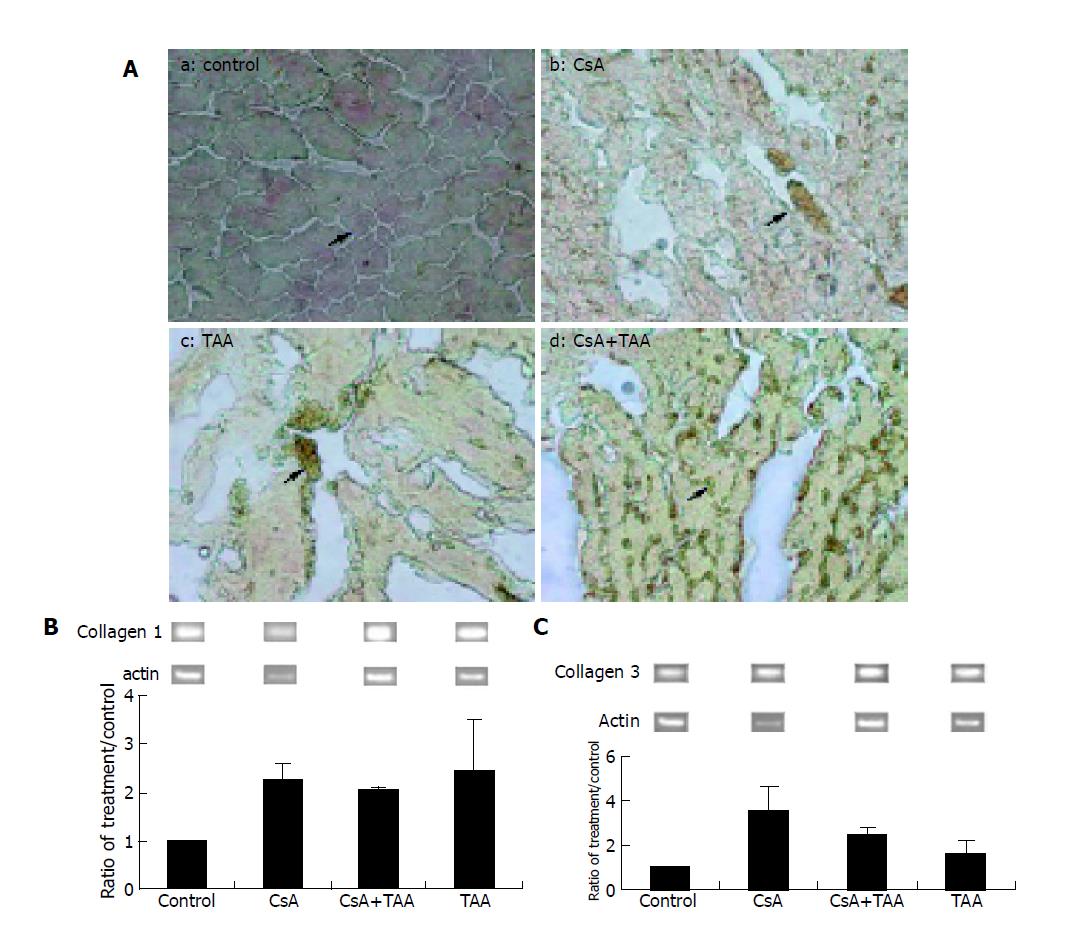
Figure 2 Levels of (A) collagen staining, (B) collagen 1 RNA expression, and (C) collagen 3 RNA expression in rat liver after various treatments.
Immunocytochemistry of collagen (red) was stained by using Sirius red. Magnification = ×200. The expression levels of collagen 1 and 3 were measured by using semi-quantitative PCR.
Figure 3 The RNA expression levels of (A) TGFβ1, (B) TGFβR2 and (C) TGFβR3 in rat liver after various treatments by using semi-quantitative PCR.
1 represents the significant difference aP<0.05 between TAA and TAA plus CsA treatments.
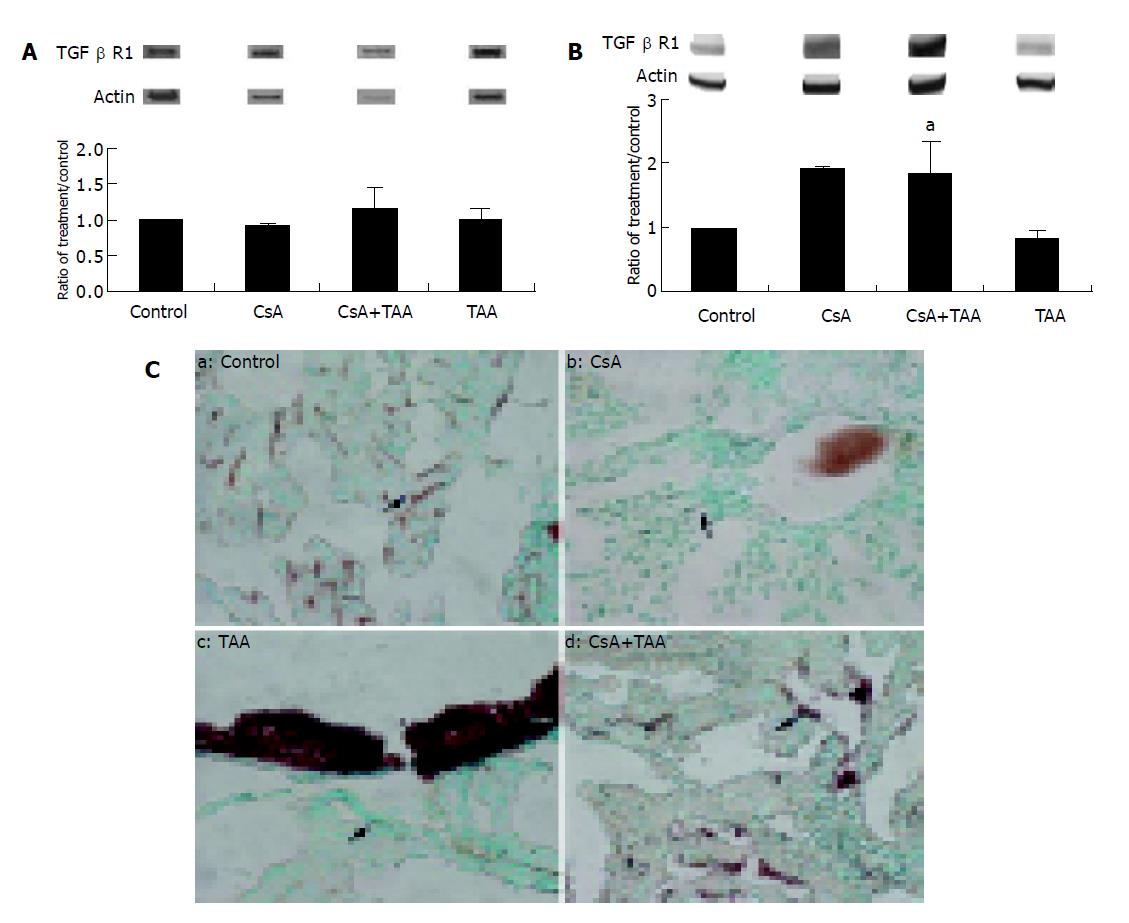
Figure 4 The levels of (A) semi-quantitative PCR for TGFβR1 RNA expression, (B) Western blot for TGFβR1 protein expression and (C) immunostaining for TGFβR1 in rat liver after various treatments.
aP<0.05 between TAA and TAA plus CsA treatments. Blue arrows indicate the positive staining and methyl green (green) for cell nuclear stained. Magnification = ×200.
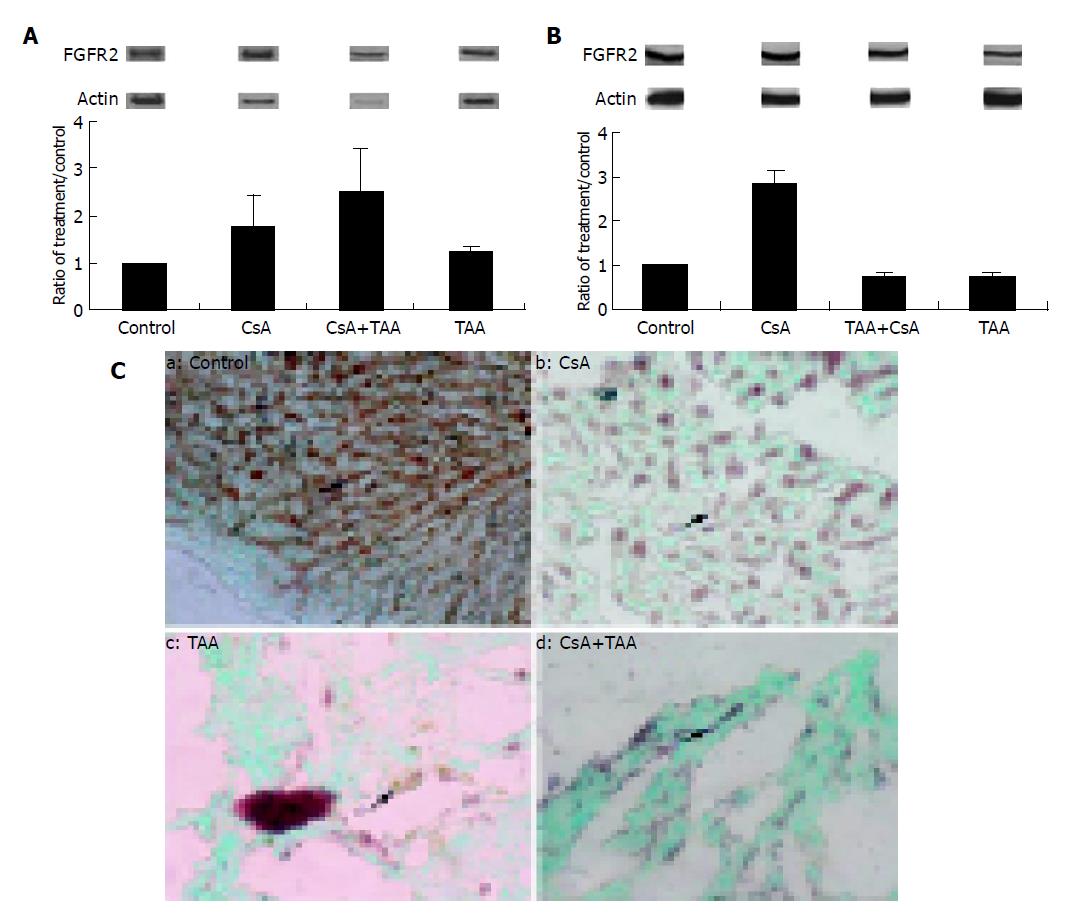
Figure 5 Levels of (A) semi-quantitative PCR for FGF receptor R2 RNA expression, (B) Western blot for FGF receptor R2 protein expression and (C) immunostaining for FGF receptor R2 in rat liver after various treatments.
Blue arrows indicate the positive staining and methyl green (green) for cell nuclear stained. Magnification = ×200.
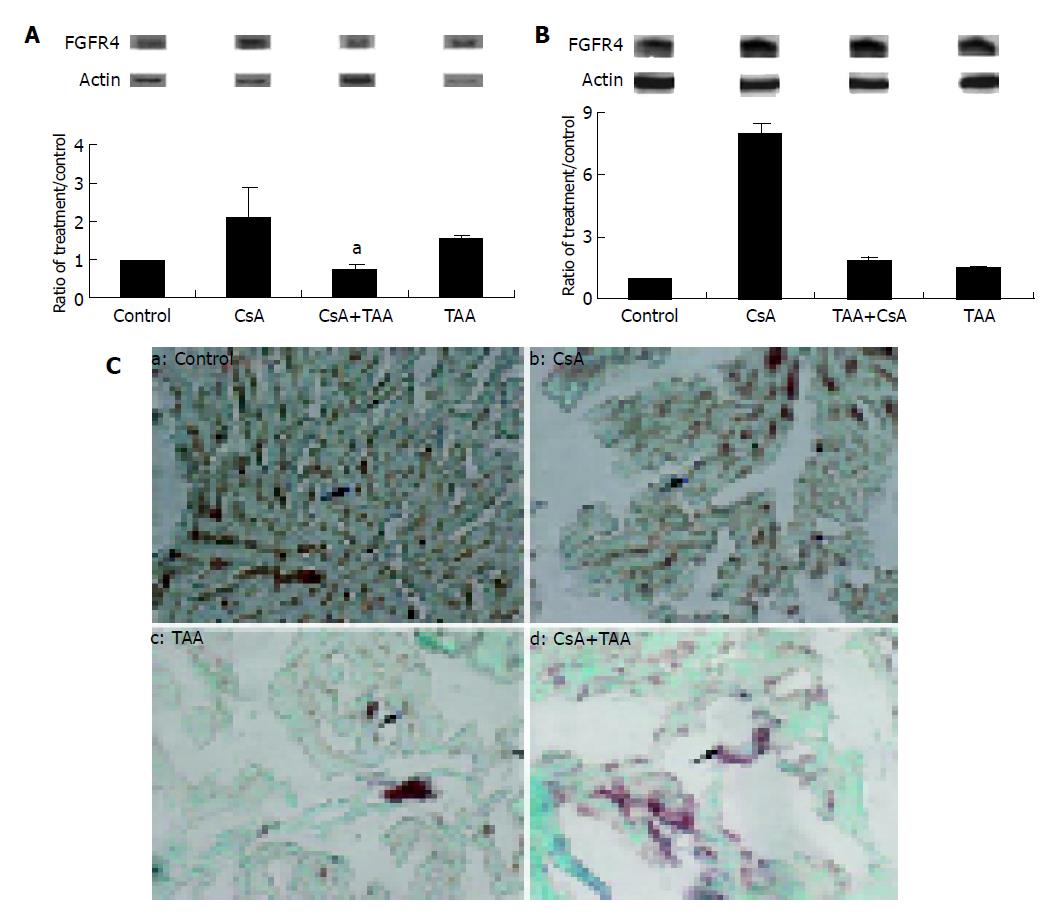
Figure 6 Levels of (A) semi-quantitative PCR for FGF receptor R4 RNA expression, (B) Western blot for FGF receptor R4 protein expression and (C) immunostaining for FGF receptor R4 in rat liver after various treatments.
aP<0.05 between TAA and TAA plus CsA treatments. Blue arrows indicate the positive staining and methyl green (green) for cell nuclear stained. Magnification ×200.
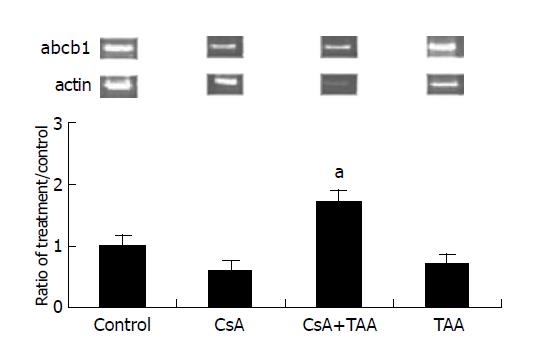
Figure 7 Levels of semi-quantitative PCR for P-gp RNA expression in rat liver after various treatments.
aP<0.05 between TAA and TAA plus CsA treatments.
- Citation: Fan S, Weng CF. Co-administration of cyclosporine A alleviates thioacetamide-induced liver injury. World J Gastroenterol 2005; 11(10): 1411-1419
- URL: https://www.wjgnet.com/1007-9327/full/v11/i10/1411.htm
- DOI: https://dx.doi.org/10.3748/wjg.v11.i10.1411


