Copyright
©2005 Baishideng Publishing Group Inc.
World J Gastroenterol. Jan 7, 2005; 11(1): 79-83
Published online Jan 7, 2005. doi: 10.3748/wjg.v11.i1.79
Published online Jan 7, 2005. doi: 10.3748/wjg.v11.i1.79
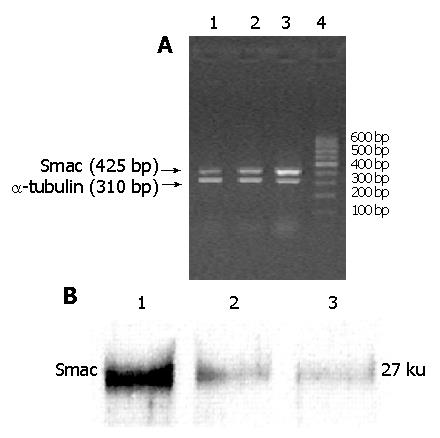
Figure 1 Cellular Smac expression detected by RT-PCR and Western blotting.
A: Cellular Smac mRNA expression detected by RT-PCR. Lane 1: MKN-45 cells; lane 2: MKN-45/neo cells; lane 3: MKN-45/Smac cells; lane 4: PCR marker (100 bp, 200 bp, 300 bp, 400 bp, 500 bp, 600 bp, 700 bp, 800 bp, 900 bp, 1000 bp). B: Cellular Smac protein expression detected by Western blotting. Lane 1: MKN-45/Smac cells; lane 2: MKN-45/neo cells; lane 3: MKN-45 cells.
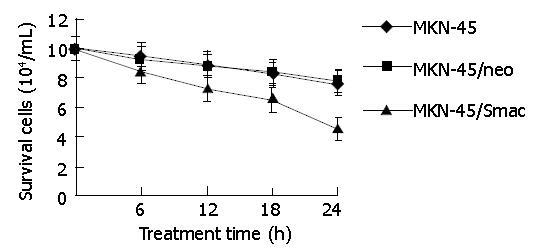
Figure 2 In vitro growth curves of gastric cancer cells after treatment with 10 mg/L MMC.
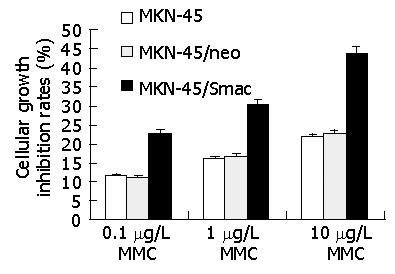
Figure 3 Growth inhibitory effects of various concentrations of MMC on gastric cancer cells.
Figure 4 Cellular morphological changes of MKN-45/Smac before and after treatment with MMC under electron microscope, ×5000.
A: Cellular ultrastructure before treatment with MMC; B: Cellular chromatin congregating around nuclear membrane after treatment with 10 mg/L MMC for 24 h; C: Cellular nuclear shrinking after treatment with 10 mg/L MMC for 24 h.
Figure 5 Apoptosis determination in gastric cancer cells by annexin V-FITC and propidium iodide staining flow cytometry.
A: MMC untreated control; B: MKN-45 cells treated with 10 mg/L MMC for 24 h; C: MKN-45/neo cells treated with 10 mg/L MMC for 24 h; D: MKN-45/Smac cells treated with 1 0 mg/L MMC for 24 h.
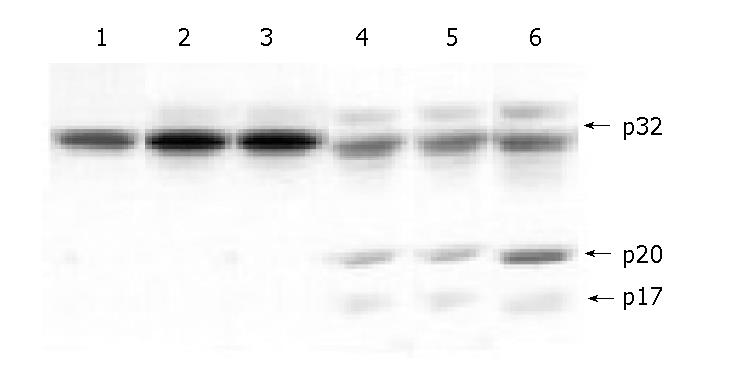
Figure 6 Cellular caspase-3 expression detected by Western blotting.
Lane 1: MKN-45 cells untreated with MMC; lane 2: MKN-45/neo cells untreated with MMC; lane 3: MKN-45/Smac cells untreated with MMC; lane 4: MKN-45 cells treated with 10 mg/L MMC; lane 5: MKN-45/neo cells treated with 10 mg/L MMC; lane 6: MKN-45/Smac cells treated with 10 mg/L MMC.
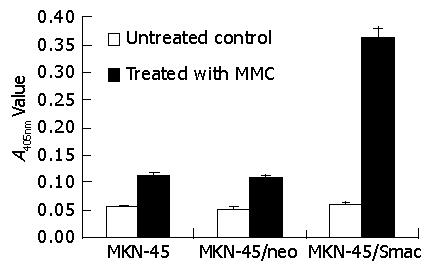
Figure 7 Caspase-3 activities detected in gastric cancer cells before and after treatment with 10 mg/L MMC.
- Citation: Zheng LD, Tong QS, Wang L, Liu J, Qian W. Stable transfection of extrinsic Smac gene enhances apoptosis-inducing effects of chemotherapeutic drugs on gastric cancer cells. World J Gastroenterol 2005; 11(1): 79-83
- URL: https://www.wjgnet.com/1007-9327/full/v11/i1/79.htm
- DOI: https://dx.doi.org/10.3748/wjg.v11.i1.79


