Copyright
©2005 Baishideng Publishing Group Inc.
World J Gastroenterol. Jan 7, 2005; 11(1): 46-50
Published online Jan 7, 2005. doi: 10.3748/wjg.v11.i1.46
Published online Jan 7, 2005. doi: 10.3748/wjg.v11.i1.46
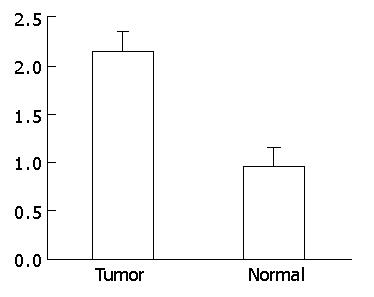
Figure 1 Total NOS activity in gastric adenocarcinoma and normal tissues [pmole/(min·mg) protein].
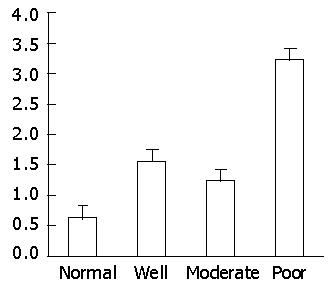
Figure 2 Total NOS activity of gastric cancer by histological classification [pmole/(min·mg) protein].
Normal: normal gastric mucosa Well: well differentiated Moderate: moderately differentiated Poor: poorly differentiated.
Figure 3 Immunohistochemical strong staining for NOS in cytoplasm (SP), ×400.
A: Expression of iNOS in gastric cancer cells; B: Expression of eNOS in gastric mucosal cells.
Figure 4 Expression of NOS mRNA in gastric cancer (ISH), ×400.
A: Strong iNOS mRNA expression; B: Weak eNOS mRNA expression.
Figure 5 Immunohistochemical strong staining for p53 or PCNA in nuclei of gastric cancer cells (SP), ×400.
A: p53 protein expression; B: PCNA protein expression.
- Citation: Wang YZ, Cao YQ, Wu JN, Chen M, Cha XY. Expression of nitric oxide synthase in human gastric carcinoma and its relation to p53, PCNA. World J Gastroenterol 2005; 11(1): 46-50
- URL: https://www.wjgnet.com/1007-9327/full/v11/i1/46.htm
- DOI: https://dx.doi.org/10.3748/wjg.v11.i1.46


