Copyright
©The Author(s) 2004.
World J Gastroenterol. May 1, 2004; 10(9): 1382-1385
Published online May 1, 2004. doi: 10.3748/wjg.v10.i9.1382
Published online May 1, 2004. doi: 10.3748/wjg.v10.i9.1382
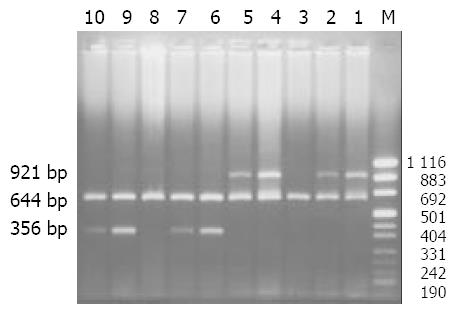
Figure 1 Semi-quantitative RT-PCR amplified products of Ang-2 and VEGF in primary gastric cancer and adjacent normal tissue 644 bp: internal standards, 921 bp: Ang-2 expression, 365 bp: VEGF expression, Lane-M: puc mix marker 8 (1116, 883, 692, 501, 404, 331, 242, 190, 147, 110, 67, 34, 26, 19) bp, Lanes 1-5: Ang-2 expression, Lanes 6-10: VEGF expression.
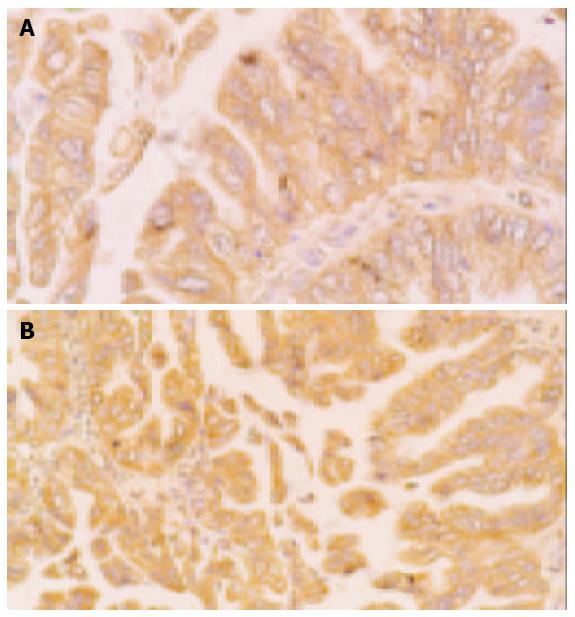
Figure 2 Expression of Ang-2 and VEGF in gastric cancer.
A: Ang-2 positive expression in gastric cancer (× 400); B: VEGF positive expression in gastric cancer (× 400).
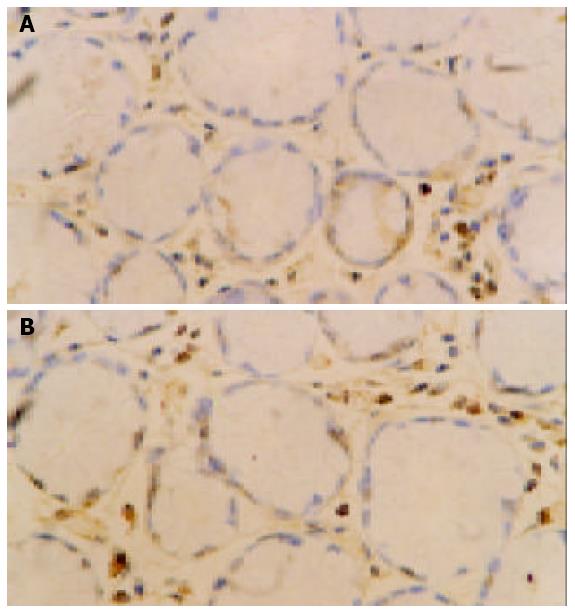
Figure 3 Expression of Ang-2 and VEGF in adjacent normal tissue.
A: Ang-2 negative expression in adjacent normal tissue (× 400); B: VEGF negative expression in adjacent normal tissue (× 400).
- Citation: Sun XD, Liu XE, Wu JM, Cai XJ, Mou YP, Li JD. Expression and significance of angiopoietin-2 in gastric cancer. World J Gastroenterol 2004; 10(9): 1382-1385
- URL: https://www.wjgnet.com/1007-9327/full/v10/i9/1382.htm
- DOI: https://dx.doi.org/10.3748/wjg.v10.i9.1382


