Copyright
©The Author(s) 2004.
World J Gastroenterol. May 1, 2004; 10(9): 1301-1305
Published online May 1, 2004. doi: 10.3748/wjg.v10.i9.1301
Published online May 1, 2004. doi: 10.3748/wjg.v10.i9.1301
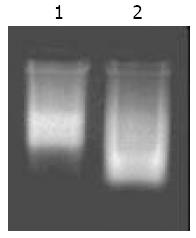
Figure 1 Quality identification of mRNA extracted from two cell lines.
Lane 1: SW480 cell line, Lane 2: SW620 cell line.
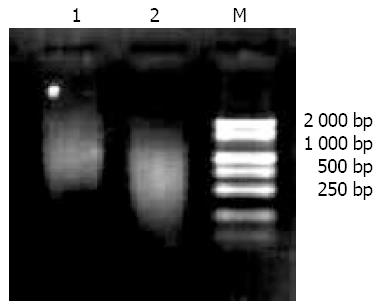
Figure 2 RsaI digestion analysis of synthesized cDNA.
Lane 1: Synthesized cDNA digested with RsaI, Lane 2: Synthesized cDNA, Lane M: Marker DGL2000.
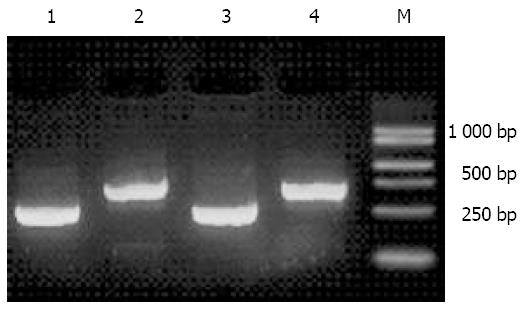
Figure 3 Ligation efficiency analysis of ds cDNA.
Lane 1: PCR products using tester1-1 (adaptor1-ligated-cDNA fragment) as the template and the G3PDH3’, 5’ primer; Lane 2: PCR prod-ucts using tester1-1 as the template and the G3PDH3’ primer, PCR primer1; Lane 3: PCR products using tester1-2 (adaptor2R-ligated-cDNA fragments) as the template and the G3PDH3’, 5’ primer; Lane 4: PCR products using tester1-2 as the template and the G3PDH3’ primer, PCR primer1; Lane M: Marker DGL2000.
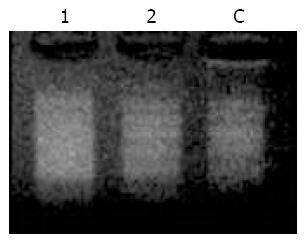
Figure 4 Electrophoresis of secondary PCR products.
Lane C: Positive control cDNA supplied with the kit, Lane 1: Unsubtracted cDNA, Lane 2: Subtracted cDNA.
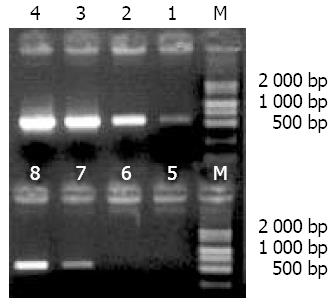
Figure 5 Reduction of G3PDH by PCR subtraction.
Lanes 1-4: Unsubtracted secondary PCR products, Lanes 5-8: Subtracted secondary PCR products, Lanes 1, 5: 18 cycles Lane 2, 6: 23 cycles, Lanes 3, 7: 28 cycles, Lane 4, 8: 33 cycles, Lane M: Marker DGL2000.
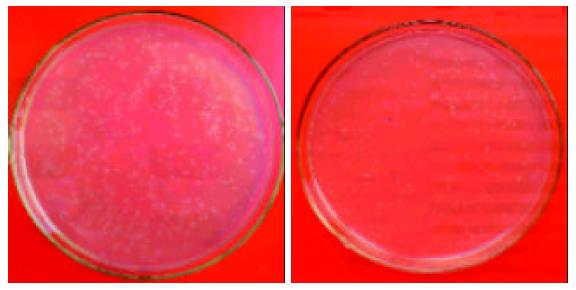
Figure 6 Blue/white screening for target clones.
Two hundred and thirty-five white clones (86%) and 37 blue clones were seen on the agar plates in group A, and 232 white clones (91%) and 21 blue clones were seen in group R.
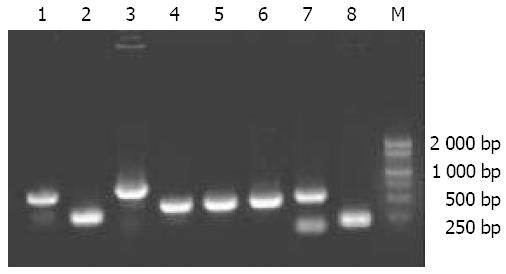
Figure 7 Different lengths of cDNA fragments from white clones amplified by PCR.
Lanes 1-8: Randomly-selected white clones, Lane M: Marker DGL2000.
- Citation: Liang L, Ding YQ, Li X, Yang GZ, Xiao J, Lu LC, Zhang JH. Construction of a metastasis-associated gene subtracted cDNA library of human colorectal carcinoma by suppression subtraction hybridization. World J Gastroenterol 2004; 10(9): 1301-1305
- URL: https://www.wjgnet.com/1007-9327/full/v10/i9/1301.htm
- DOI: https://dx.doi.org/10.3748/wjg.v10.i9.1301


