Copyright
©The Author(s) 2004.
World J Gastroenterol. May 1, 2004; 10(9): 1276-1280
Published online May 1, 2004. doi: 10.3748/wjg.v10.i9.1276
Published online May 1, 2004. doi: 10.3748/wjg.v10.i9.1276
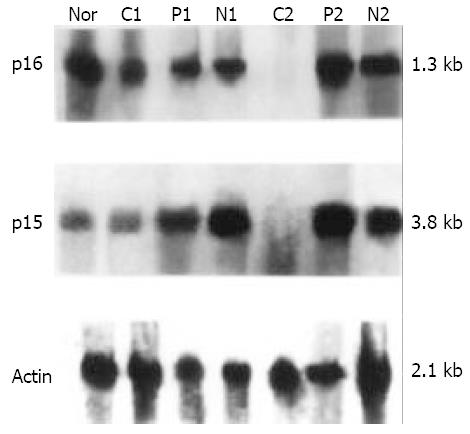
Figure 1 Northern blot analysis of the p16 and p15 genes in human primary heparocarcinoma.
Total RNA from tissues of human primary heparocarcinoma was hybridized with cDNA fragment probes of p16, p15 and γ-actin labeled with non-radiated digoxinin. N: Normal liver tissue control; C, P, N represent RNA from cancerous, para-cancerous, non-cancerous liver tissues respectively; 1, 2 represent the No. of HCC patient.
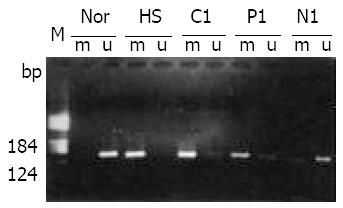
Figure 2 Methylation analysis of p16 gene in human primary heparocarcinoma.
MSP product of p16 gene from HCC tissues was electrophoresed on a 25 g/L agarose gel. M: pBR322/ HeaIII DNA molecular marker; N: Normal liver tissue DNA; HS: HS-Sultan DNA (positive control); C, P, N represent RNA from cancerous, para-cancerous, non-cancerous liver tissue respectively; 1, 2 mark the HCC patient number; m: PCR prod-ucts from methylation specific primers, u: PCR products from unmethylation specific primers.
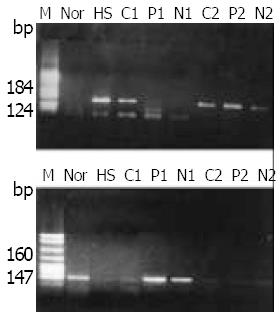
Figure 3 Methylation analysis of p15 gene in human primary heparocarcinoma.
MSP product of p15 gene from HCC tissues was electrophoresed on a 2.5% agarose gel. M: pBR322/HeaIII DNA molecular marker (in graph m) or PBR322/Msp I DNA marker (in graph u); N: Normal liver tissue DNA; HS: HS-Sul-tan DNA (positive control); C, P, N represent RNA from cancerous, paracancerous, non-cancerous liver tissue respectively; 1, 2 mark the HCC patient number; m: PCR products from methylation specific primers, u: PCR products from unmethylation specific primers.
- Citation: Qin Y, Liu JY, Li B, Sun ZL, Sun ZF. Association of low p16INK4a and p15INK4b mRNAs expression with their CpG islands methylation with human hepatocellular carcinogenesis. World J Gastroenterol 2004; 10(9): 1276-1280
- URL: https://www.wjgnet.com/1007-9327/full/v10/i9/1276.htm
- DOI: https://dx.doi.org/10.3748/wjg.v10.i9.1276


