Copyright
©The Author(s) 2004.
World J Gastroenterol. May 1, 2004; 10(9): 1268-1275
Published online May 1, 2004. doi: 10.3748/wjg.v10.i9.1268
Published online May 1, 2004. doi: 10.3748/wjg.v10.i9.1268
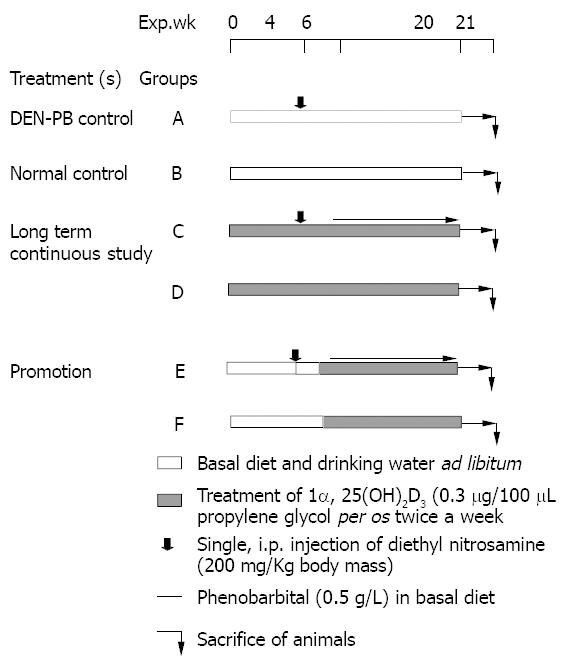
Figure 1 Basic experimental protocol.
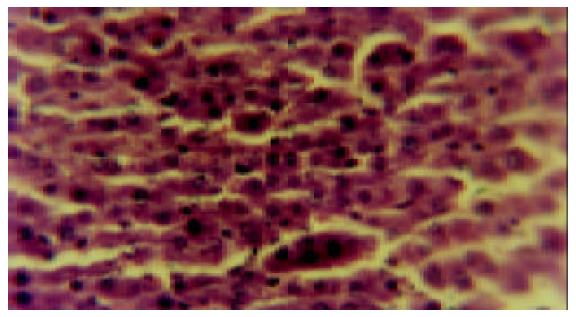
Figure 4 Shows the section of the rat liver (group A) showing abnormal hepatic architecture after a single i.
p. Injection of DEN (200 mg/kg b.m.) (HE × 325).
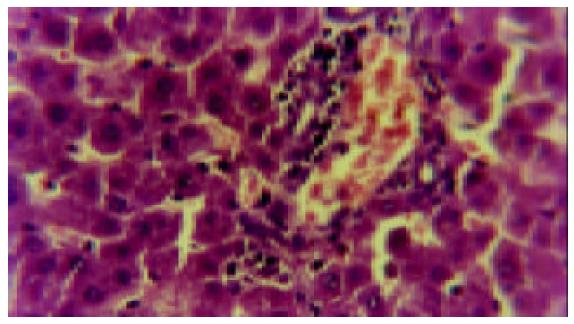
Figure 5 Shows the thin section of normal rat liver untreated (group B) showing hepatocellular architecture (HE × 325).
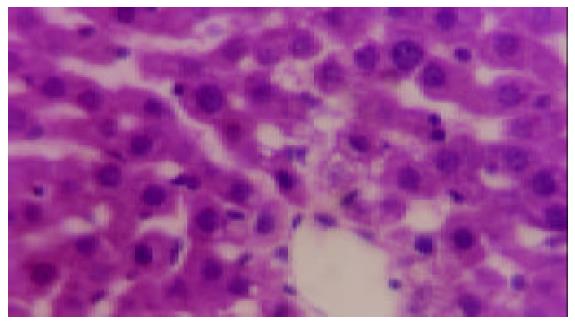
Figure 6 Shows section of rat liver (group C) initiated with DEN and supplemented with 1α, 25(OH)2D3 [0.
3 μg/100 μL propylene glycol per os twice a week for 20 wk] showing almost normal hepatic architecture (HE × 325).
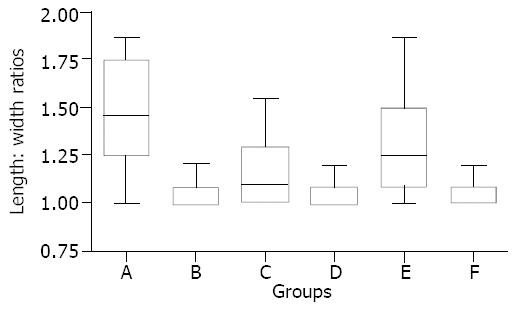
Figure 2 Box-and-whisker plot of the distribution of DNA damage treated with 1alpha, 25(OH)2D3 in DEN induced rat hepatocarcinogenesis promoted by phenobarbital.
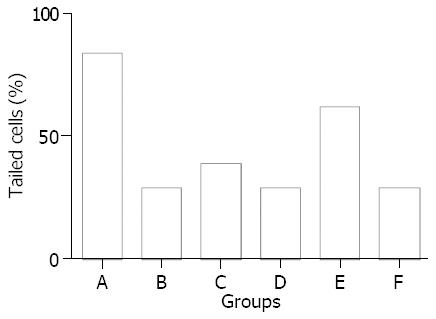
Figure 3 Tailed cells (%) in hepatic cells of rats treated with 1alpha, 25(OH)2D3 in DEN induced rat hepatocarcinogenesis promoted by phenobarbital.
- Citation: Banakar MC, Paramasivan SK, Chattopadhyay MB, Datta S, Chakraborty P, Chatterjee M, Kannan K, Thygarajan E. 1α, 25-dihydroxyvitamin D3 prevents DNA damage and restores antioxidant enzymes in rat hepatocarcinogenesis induced by diethylnitrosamine and promoted by phenobarbital. World J Gastroenterol 2004; 10(9): 1268-1275
- URL: https://www.wjgnet.com/1007-9327/full/v10/i9/1268.htm
- DOI: https://dx.doi.org/10.3748/wjg.v10.i9.1268


