Copyright
©The Author(s) 2004.
World J Gastroenterol. Apr 15, 2004; 10(8): 1141-1145
Published online Apr 15, 2004. doi: 10.3748/wjg.v10.i8.1141
Published online Apr 15, 2004. doi: 10.3748/wjg.v10.i8.1141
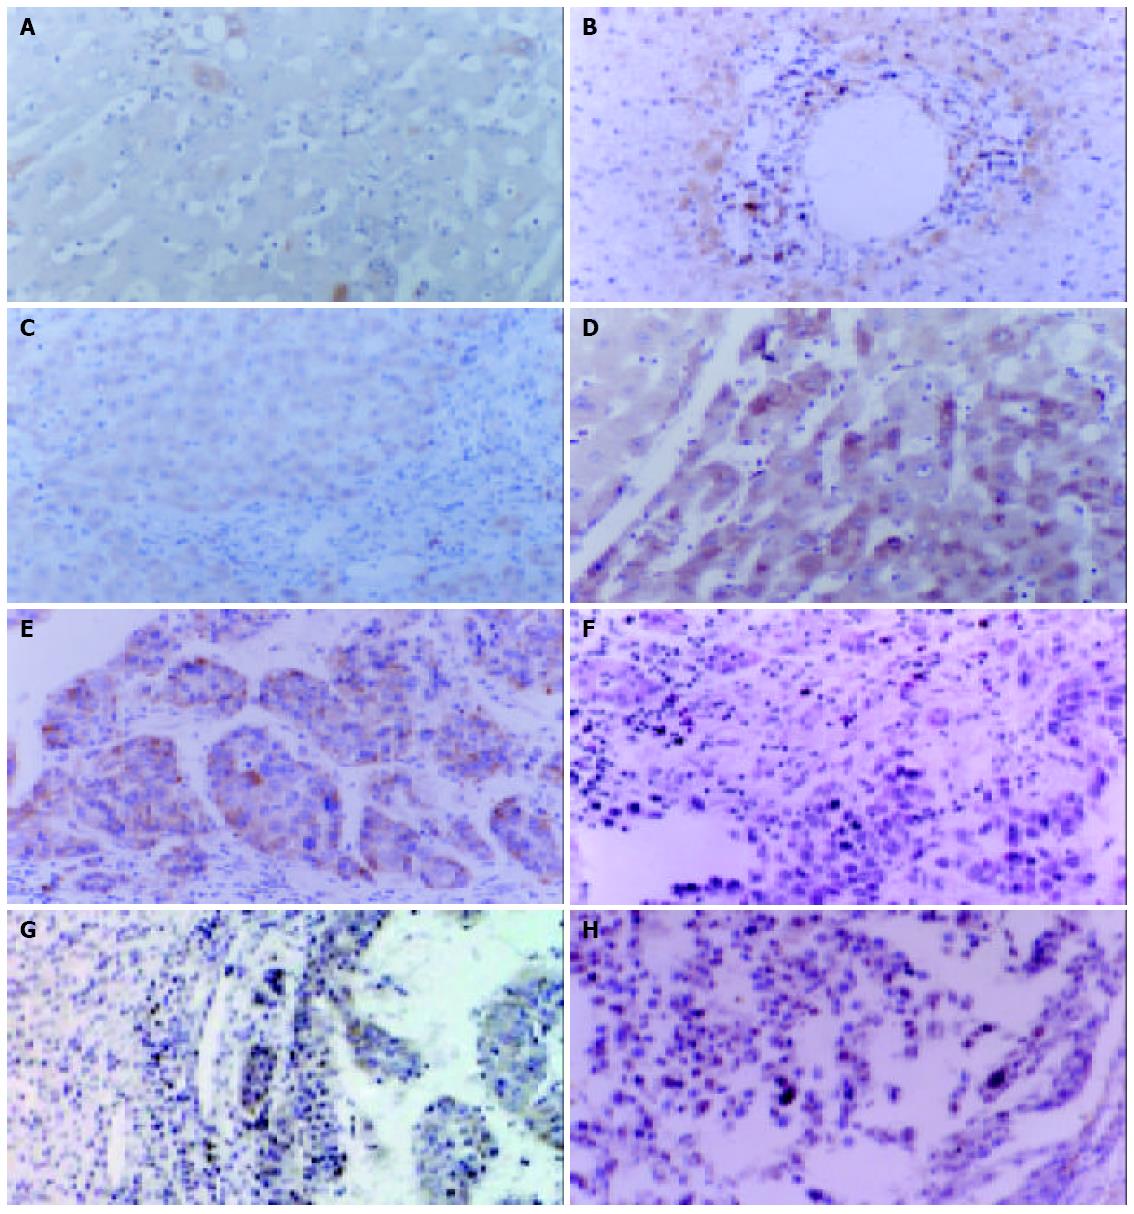
Figure 1 Sections of immunoperoxidase staining for gp96 in chronic hepatitis liver, liver cirrhosis and HCC.
Several representa-tive liver tissues with A: gp96 negative in chronic hepatitis, B: gp96 weakly positive in chronic hepatitis, C: gp96 strongly positive in chronic hepatitis, D: gp96 strongly detected in liver cirrhosis, E: gp96 strongly positive in HCC, F: gp96 positive in the nuclear and cytoplasmic staining, G: Cytoplasmic gp96 staining significantly higher in HCC cells than in adjacent non-tumorous liver cells, and H: gp96 expression in HCC accompanied by lymphocyte infiltration (indicated by arrow).
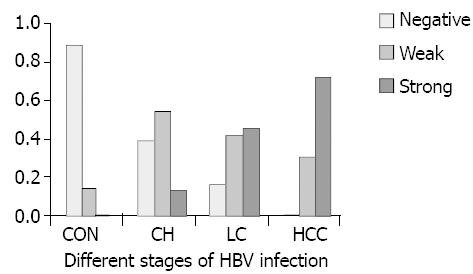
Figure 2 Correlation of gp96 expression and the progression of hepatitis B virus induced diseases.
For the definition of gp96 stain-ing density (negative, weak and strong), please see Materials and Methods. X-axis, different stages of HBV infection; Y axis, the percentage of classified samples numbers in total numbers of each group samples. CON: control normal liver tissue; CH: chronic hepatitis; LC: liver cirrhosis; HCC: hepatocellular carcinoma.
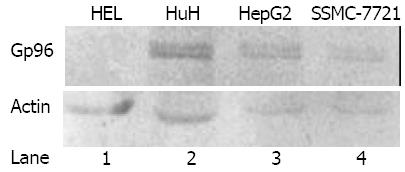
Figure 3 Western blotting analysis of gp96 expression in HCC cell lines and human embryonic liver cells (HEL).
Clearly shown in the figure are high-level expression of gp96 in the HCC cell lines but not in HEL. Actin expression level was used as SDS-PAGE loading control.
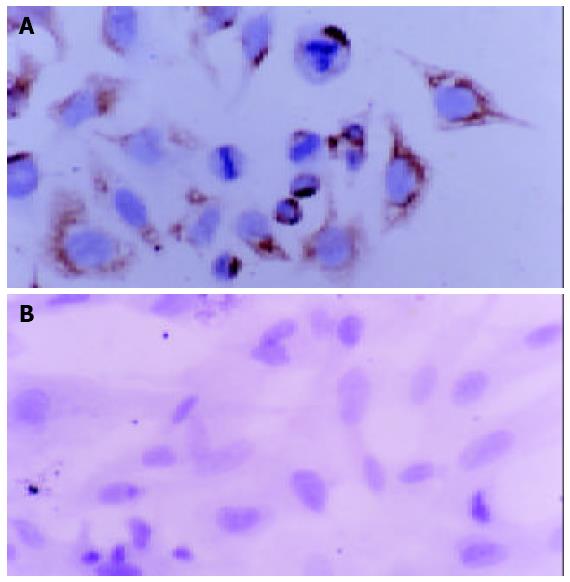
Figure 4 Immunocytochemical analysis of gp96 in HCC cell line SSMC-7721 (A) and HEL (B).
High-level expression of gp96 was seen in SSMC-7721, but not in HEL.
- Citation: Zhu XD, Li CL, Lang ZW, Gao GF, Tien P. Significant correlation between expression level of HSP gp96 and progression of hepatitis B virus induced diseases. World J Gastroenterol 2004; 10(8): 1141-1145
- URL: https://www.wjgnet.com/1007-9327/full/v10/i8/1141.htm
- DOI: https://dx.doi.org/10.3748/wjg.v10.i8.1141


