Copyright
©The Author(s) 2004.
World J Gastroenterol. Apr 15, 2004; 10(8): 1098-1102
Published online Apr 15, 2004. doi: 10.3748/wjg.v10.i8.1098
Published online Apr 15, 2004. doi: 10.3748/wjg.v10.i8.1098
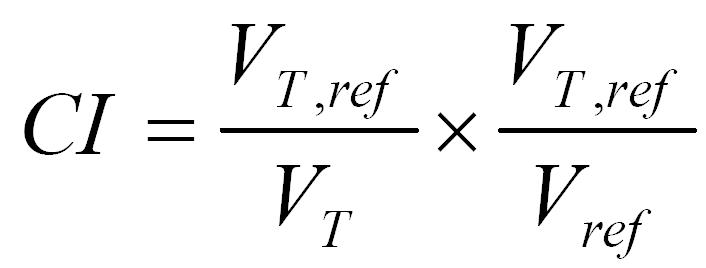
Math 1 Math(A1).
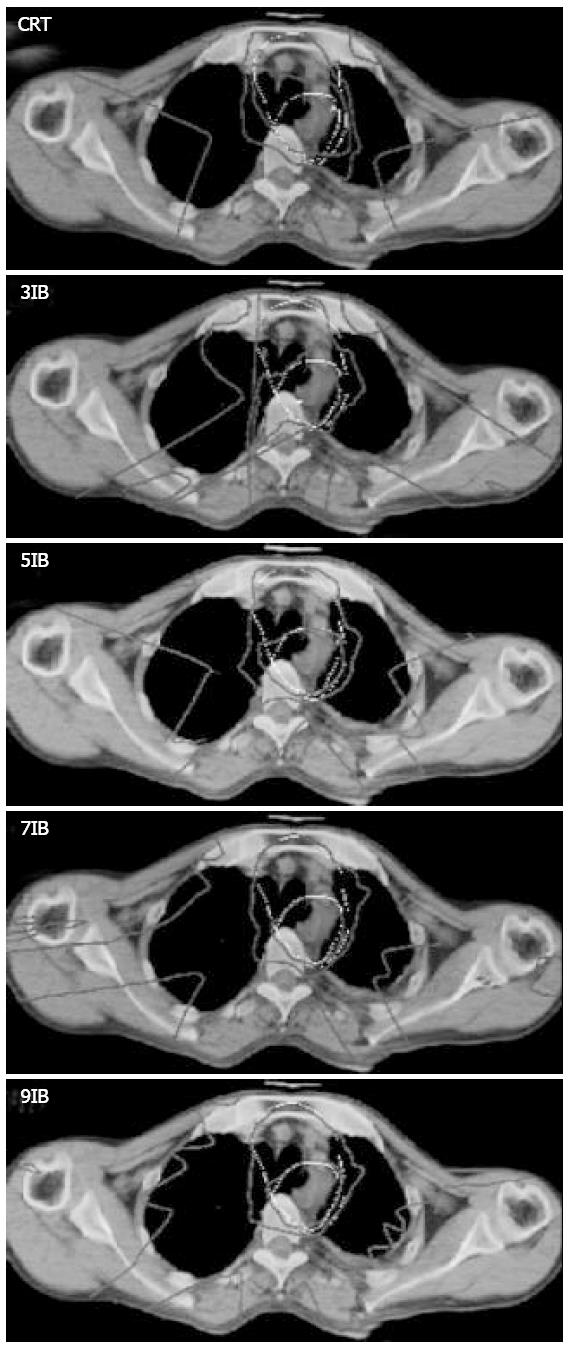
Figure 1 Isodose distributions on axial images for CRT and IMRT plans of patient 3.
The white lines represent PTV1 and PTV2. PTV1 was inside PTV2. The isodose levels of 67.2 Gy, 50.4 Gy and 20 Gy were shown. IB stands for intensity-modulated beam.
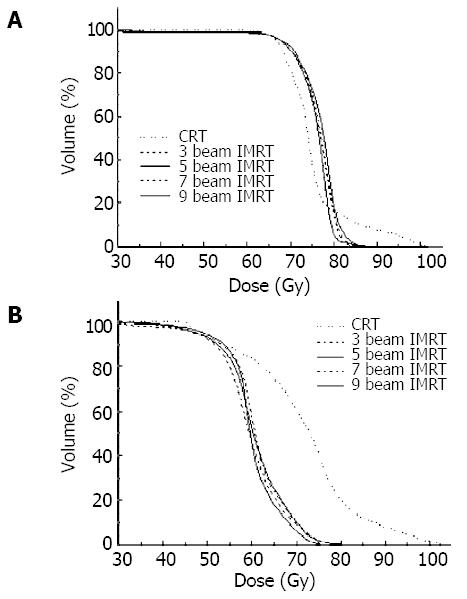
Figure 2 DVHs of PTVs for CRT and IMRT plans of patient 3.
(A), PTV1; (B), PTV2.
- Citation: Fu WH, Wang LH, Zhou ZM, Dai JR, Hu YM, Zhao LJ. Comparison of conformal and intensity-modulated techniques for simultaneous integrated boost radiotherapy of upper esophageal carcinoma. World J Gastroenterol 2004; 10(8): 1098-1102
- URL: https://www.wjgnet.com/1007-9327/full/v10/i8/1098.htm
- DOI: https://dx.doi.org/10.3748/wjg.v10.i8.1098


