Copyright
©The Author(s) 2004.
World J Gastroenterol. Apr 1, 2004; 10(7): 995-999
Published online Apr 1, 2004. doi: 10.3748/wjg.v10.i7.995
Published online Apr 1, 2004. doi: 10.3748/wjg.v10.i7.995
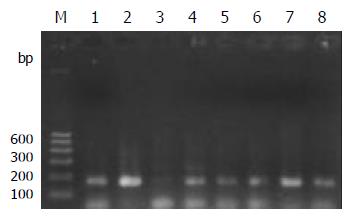
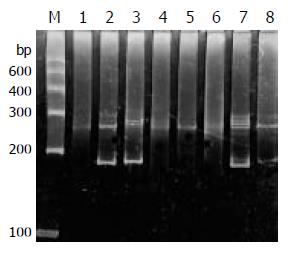
Figure 1 Agarose gel electrophoresis of the PCR products of TCR-γ gene rearrangement.
M: DNA marker; Lane 1: reactive lymph node; lane 2: Jurkat cell line; lanes 3-8: gastrointestinal lymphomas.
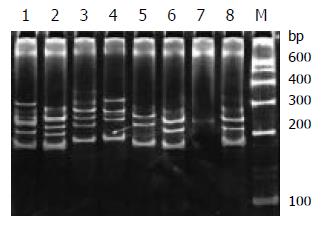
Figure 2 PCR-SSCP analysis of the plasmids inserted with TCR-γ gene rearranged segments.
M: DNA marker; Lanes 1-4: two mixed plasmids amplified products showed one double-stranded band and three to four single-stranded bands; lanes 5-8: single plasmid PCR products showed one double-stranded band and two single-stranded bands (except lane 7).
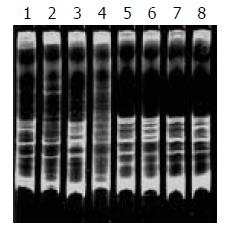
Figure 3 PCR-SSCP analysis of mixed plasmids inserted with TCR-γ gene rearranged segments.
Lanes 1-4: PCR products of 3 mixed plasmids showed one double-stranded band and about five to six single-stranded bands; Lanes 5-8: PCR product of 4 mixed plasmids showed one double-stranded band and about six to eight single-stranded bands. The double-stranded bands were broader than that in the single or double plasmids ampli-fied products.
Figure 4 PCR-SSCP analysis of some gastrointestinal lymphomas.
M: DNA marker; Lane 1: Jurkat cell line; lane 2: reactive lymph node; lanes 3-8: B-cell gastrointestinal lymphomas. Lane 5 had 4 single-stranded bands and lane 1, 7, 8 had one or two single-stranded bands. The other samples showed only smears with no predominant band.
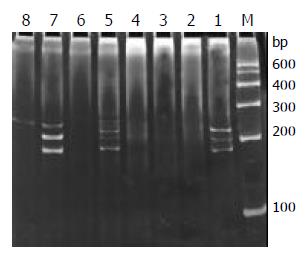
Figure 5 PCR-SSCP analysis of some T-cell gastrointestinal lymphomas.
M: DNA marker; Lane 7 presented four single-stranded bands, and the others had one or two single-stranded bands. Four of the 8 samples were absence of the double-stranded bands probably due to insufficient PCR products.
- Citation: Han XQ, He L, Shong LY, Jiang HY, Zhu MG, Zhao T. Investigation of T-cell receptor-γ gene rearrangement in gastrointestinal lymphomas by PCR-SSCP analysis. World J Gastroenterol 2004; 10(7): 995-999
- URL: https://www.wjgnet.com/1007-9327/full/v10/i7/995.htm
- DOI: https://dx.doi.org/10.3748/wjg.v10.i7.995


