Copyright
©The Author(s) 2004.
World J Gastroenterol. Apr 1, 2004; 10(7): 934-939
Published online Apr 1, 2004. doi: 10.3748/wjg.v10.i7.934
Published online Apr 1, 2004. doi: 10.3748/wjg.v10.i7.934
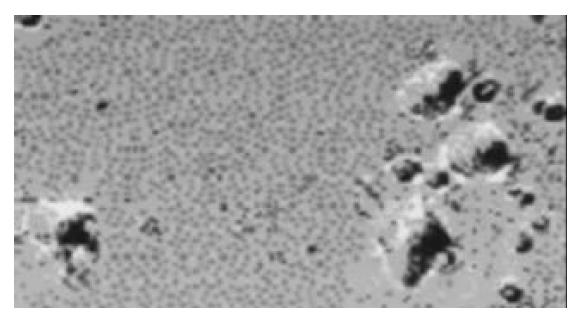
Figure 1 Typical appearance of DC cultures on 7 d.
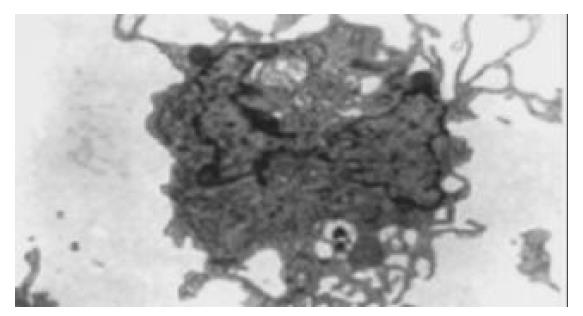
Figure 2 Transmission electron microscopy ( × 8000).
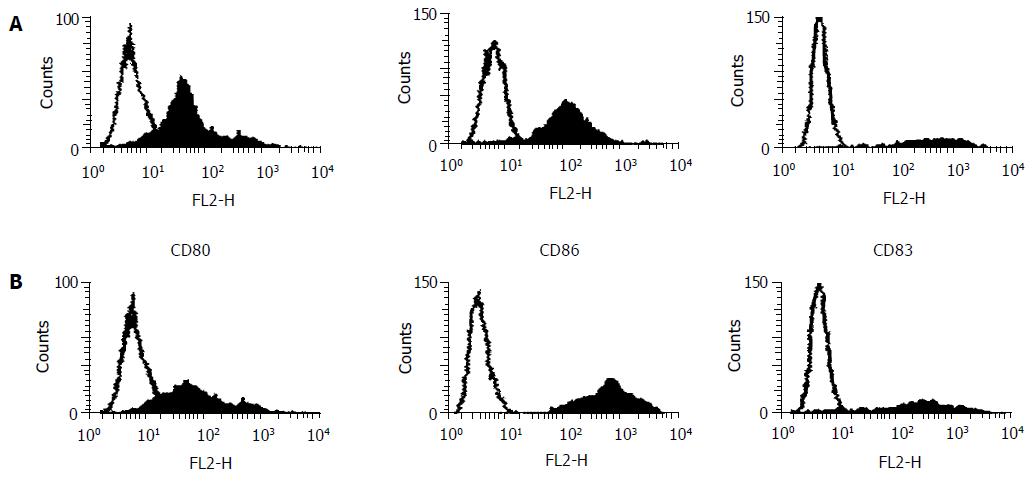
Figure 3 Surface phenotype of DCs on d 7 of culture.
Flow cytometric analyses of surface molecules in DC generated from PBMNC obtained from a healthy volunteer (A) or an EC patient (B). Representative results of one of the subjects are shown.
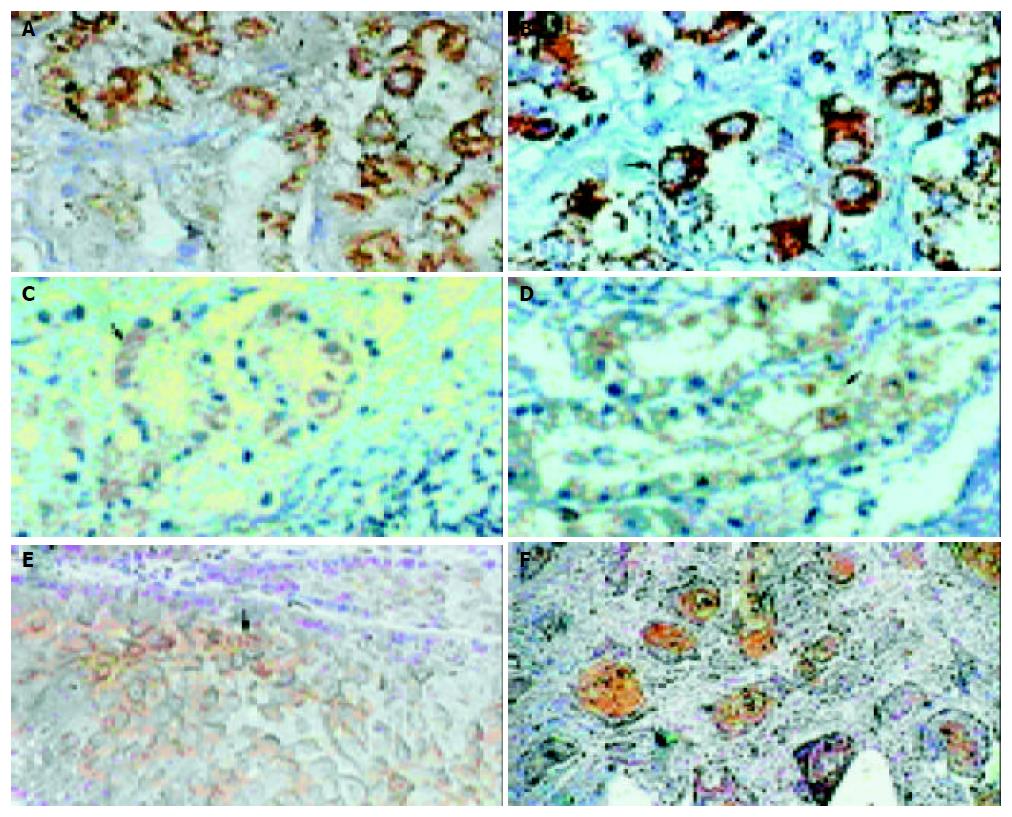
Figure 4 A: Positive expression of CD80 in NET (SP method, DAB, × 400), B: Positive expression of CD80 in ECT (SP method, DAB, × 400), C: Positive expression of CD86 in NET (SP method, DAB, × 400), D: Positive expression of CD86 in ECT (SP method, DAB, × 400), E: Positive expression of S100 protein in NET (SP method, DAB, × 400), F: Positive expression of S100 protein in ECT (SP method, DAB, × 400).
Figure 5 A: Positive expression of CD83 in PCT (New Fuchsin, × 100), B: No CD83-positive cells in cancer nodules (New Fuchsin, × 100), C: Positive expression of CD83 in ECT (New Fuchsin, × 400).
- Citation: Chen SR, Luo YP, Zhang JK, Yang W, Zhen ZC, Chen LX, Zhang W. Study on immune function of dendritic cells in patients with esophageal carcinoma. World J Gastroenterol 2004; 10(7): 934-939
- URL: https://www.wjgnet.com/1007-9327/full/v10/i7/934.htm
- DOI: https://dx.doi.org/10.3748/wjg.v10.i7.934


