Copyright
©The Author(s) 2004.
World J Gastroenterol. Apr 1, 2004; 10(7): 1043-1046
Published online Apr 1, 2004. doi: 10.3748/wjg.v10.i7.1043
Published online Apr 1, 2004. doi: 10.3748/wjg.v10.i7.1043
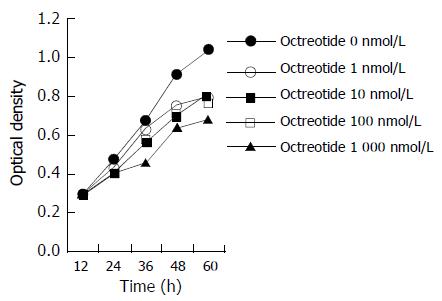
Figure 1 The inhibitory effect of octreotide on growth curve of GBC-SD.
Each value was the mean of 5 duplicate wells.
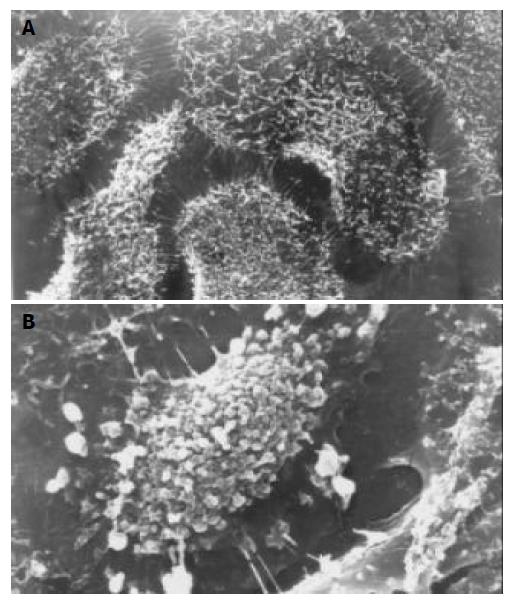
Figure 2 Apoptotic appearance of GBC-SD under SEM.
A: control (1500 × ). B: after exposure to 1000 nmol/L octreotide for 72 h (3500 × ).
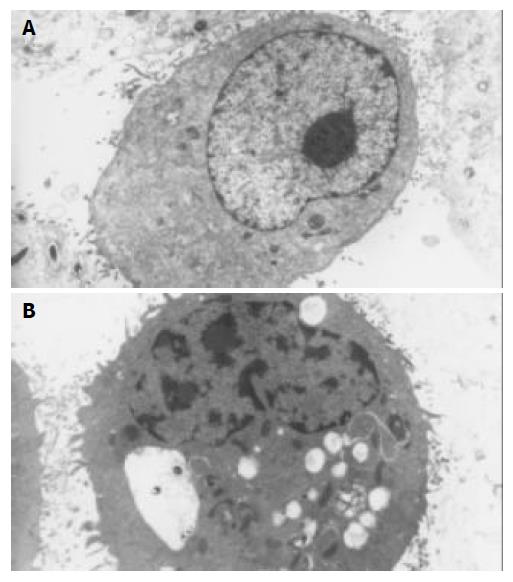
Figure 3 Apoptotic appearance of GBC-SD under TEM.
A: control (5600 × ). B: after exposure to 1 000 nmol/L octreotide for 72 h (6400 × ).
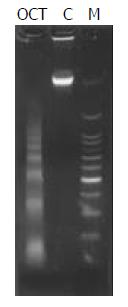
Figure 4 DNA ladder of GBC-SD after exposure to octreotide.
M: marker. OCT: 1000 nmol/L octreotide group. C: control group.
- Citation: Wang JH, Xing QT, Yuan MB. Antineoplastic effects of octreotide on human gallbladder cancer cells in vitro. World J Gastroenterol 2004; 10(7): 1043-1046
- URL: https://www.wjgnet.com/1007-9327/full/v10/i7/1043.htm
- DOI: https://dx.doi.org/10.3748/wjg.v10.i7.1043


