Copyright
©The Author(s) 2004.
World J Gastroenterol. Apr 1, 2004; 10(7): 1000-1004
Published online Apr 1, 2004. doi: 10.3748/wjg.v10.i7.1000
Published online Apr 1, 2004. doi: 10.3748/wjg.v10.i7.1000
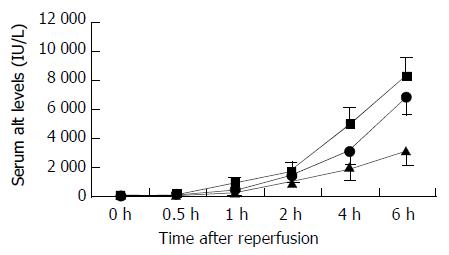
Figure 1 Changes in serum ALT levels after reperfusion.
Serum ALT levels significantly increased in the 24 h (closed square) and 18 h (closed circle) cold-preserved groups, compared with the 6 h group (closed triangle) within 0.5 h after reperfusion (P < 0.05, respectively). Results are mean ± SD for each time point in each group (n = 6).
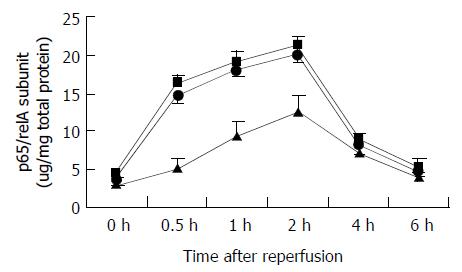
Figure 2 Changes in p65/relA subunit levels after reperfusion.
P65/relA subunit levels significantly increased in the 24 h (closed square) and 18 h (closed circle) cold-preserved groups, compared with the 6 h group (closed triangle) at 0.5 h, 1 h, and 2 h after reperfusion (P < 0.05, respectively). Results are mean ± SD for each time point in each group (n = 6).
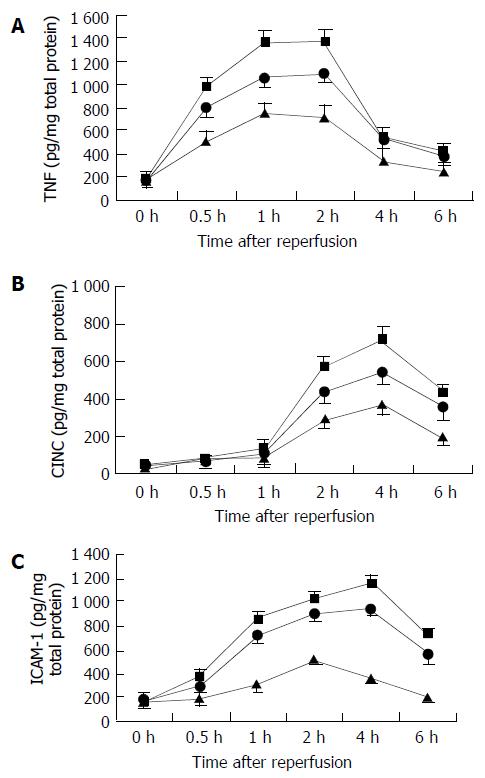
Figure 3 Changes in intrahepatic inflammatory mediator responses after reperfusion.
A: TNF-α levels, B: CINC levels, C: ICAM-1 levels. TNF-α levels significantly increased in the 24 h and 18 h groups 0.5 h after reperfusion, compared with the 6 h group (P < 0.05, respectively). CINC levels significantly in-creased in the 24 h and 18 h groups 2 h after reperfusion, com-pared with the 6 h group (P < 0.05, respectively). ICAM-1 levels significantly increased in the 24 h and 18 h cold-preserved groups 1 h after reperfusion, compared with the 6 h group (P < 0.05, respectively). Results are mean ± SD for each time point in each group (n = 6). 6 h group—closed triangle, 24 h group— closed square, and 18 h group—closed circle.
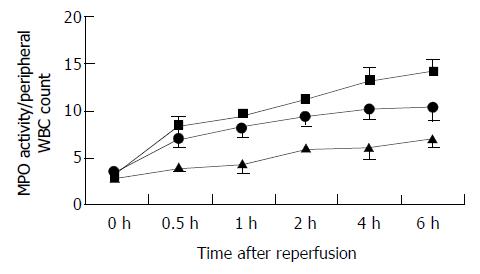
Figure 4 Changes in accumulation of neutrophils in the graft after reperfusion, as assessed by MPO/WBC.
MPO/WBC in the 24 h (closed square) and 18 h (closed circle) cold-preserved groups increased significantly, compared with the 6 h group (closed triangle) within 0.5 h after reperfusion (P < 0.05, respectively). Results are mean ± SD for each time point in each group (n = 6).
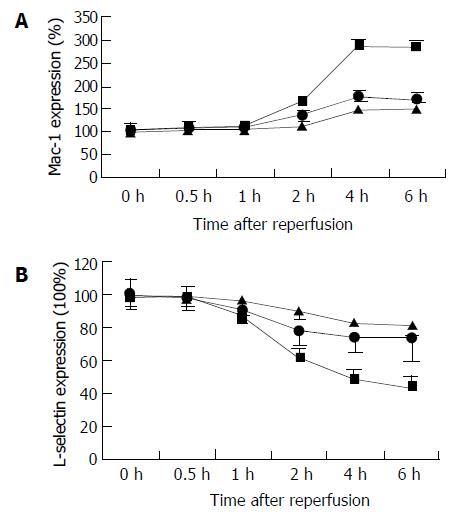
Figure 5 Changes in circulating neutrophil activity in the recipents after reperfusion, as assessed by CD11b and L-selectin expression.
A: CD11b expression, B: L-selectin expression. CD11b expression elevated significantly in the 24 h (closed square) and 18 h (closed circle) groups, compared with the 6 h group (closed triangle) 2 h after reperfusion (P < 0.05, respectively). L- selectin shed significantly in the 24 h (closed square) and 18 h (closed circle) groups, compared with the 6 h group (closed triangle) 1 h after reperfusion (P < 0.05, respectively). Results are the mean ± SD for each time point in each group (n = 6).
- Citation: Gu XP, Jiang Y, Xu FT, Qiu YD, Ding YT. Effect of cold-ischemia time on nuclear factor-κB activation and inflammatory response in graft after orthotopic liver transplantation in rats. World J Gastroenterol 2004; 10(7): 1000-1004
- URL: https://www.wjgnet.com/1007-9327/full/v10/i7/1000.htm
- DOI: https://dx.doi.org/10.3748/wjg.v10.i7.1000


