Copyright
©The Author(s) 2004.
World J Gastroenterol. Feb 15, 2004; 10(4): 555-559
Published online Feb 15, 2004. doi: 10.3748/wjg.v10.i4.555
Published online Feb 15, 2004. doi: 10.3748/wjg.v10.i4.555
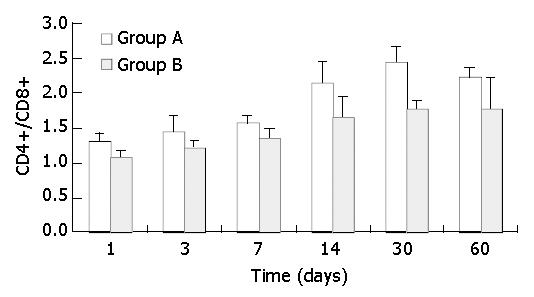
Figure 1 CD4+/CD8+ expression of groups A and B after trans-plantation (n = 4).
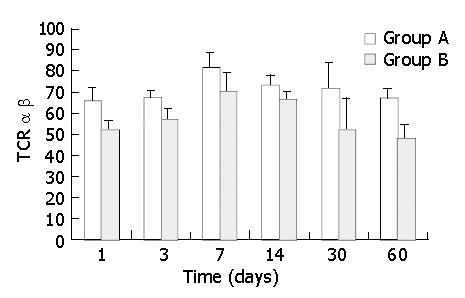
Figure 2 TCR αβ expression in T cells of groups A and B after transplantation (n = 4).
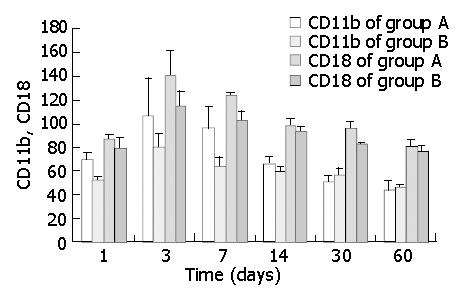
Figure 3 CD11b and CD18 expression on PMNs of groups A and B after transplantation (n = 4).
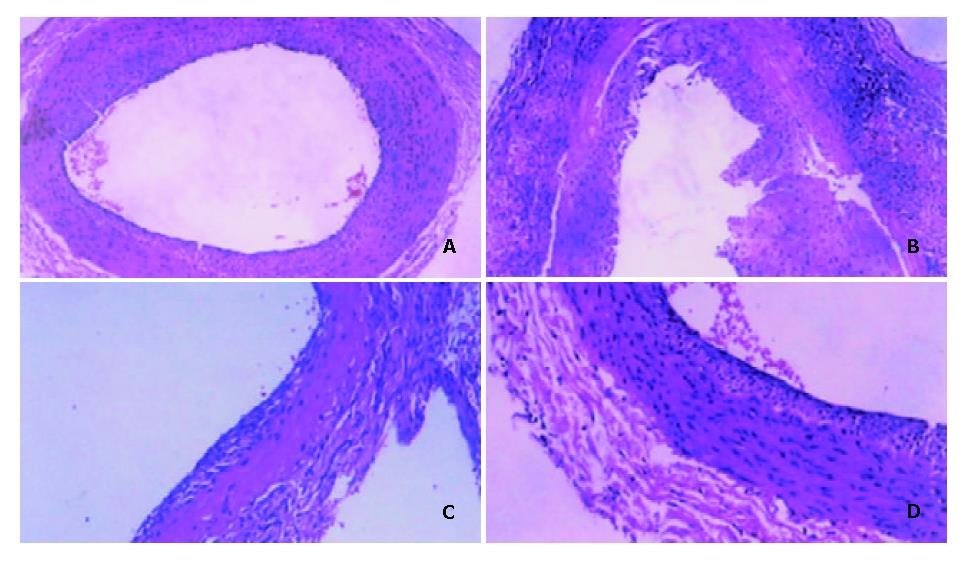
Figure 4 HE staining of abdominal aorta in rats after transplantation.
A: Infiltration of T cells at 4 weeks in group A (× 100), B: Excessively thickened intima at 8 weeks in group A(× 100), C: Completely recovered ECs of cryopreserved aorta at 4 weeks in group B (× 100), D: Intact and slightly thickened intima at 8 weeks in group B (× 100).
- Citation: Gu S, Liu CJ, Qiao T, Sun XM, Chen JH. Abdominal aorta transplantation after programmed cryopreservation. World J Gastroenterol 2004; 10(4): 555-559
- URL: https://www.wjgnet.com/1007-9327/full/v10/i4/555.htm
- DOI: https://dx.doi.org/10.3748/wjg.v10.i4.555


