Copyright
©The Author(s) 2004.
World J Gastroenterol. Nov 15, 2004; 10(22): 3385-3387
Published online Nov 15, 2004. doi: 10.3748/wjg.v10.i22.3385
Published online Nov 15, 2004. doi: 10.3748/wjg.v10.i22.3385
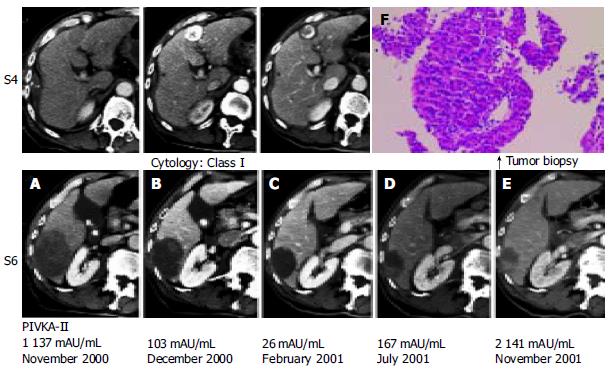
Figure 1 Enhanced computed tomography (CT).
A: A low-density mass located in liver S4, with marginal enhancement and a cystic mass of 68 mm × 55 mm in S6. B: Lipiodol accumulation in the tumor in S4 and the cystic mass in S6. C: Microwave coagulation performed for HCC in S4 during cholecystectomy. D: Further decrease in tumor size and enhanced area at the posterior cystic lumen of the tumor. E: Extension of the enhanced area to the surrounding area of cystic tumor. F: A well-differentiated HCC shown by histological evaluation.
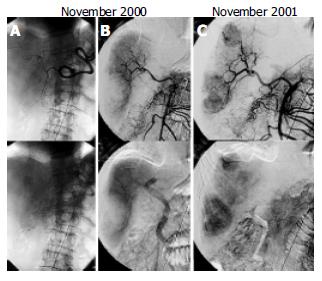
Figure 2 A: Celiac arteriogram showing tumor stain with a size of 25 mm × 20 mm in S4.
B: Blood supply of right hepatic lobe by the replaced right hepatic artery. C: Super mesenteric arteriogram demonstrating two tumor stains.
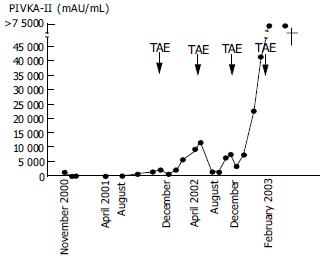
Figure 3 Clinical course of the patient.
TAE: transarterial embolization with gel foam.
- Citation: Nakajima T, Moriguchi M, Watanabe T, Noda M, Fuji N, Minami M, Itoh Y, Okanoue T. Recurrence of hepatocellular carcinoma with rapid growth after spontaneous regression. World J Gastroenterol 2004; 10(22): 3385-3387
- URL: https://www.wjgnet.com/1007-9327/full/v10/i22/3385.htm
- DOI: https://dx.doi.org/10.3748/wjg.v10.i22.3385


