Copyright
©The Author(s) 2004.
World J Gastroenterol. Oct 15, 2004; 10(20): 3001-3005
Published online Oct 15, 2004. doi: 10.3748/wjg.v10.i20.3001
Published online Oct 15, 2004. doi: 10.3748/wjg.v10.i20.3001
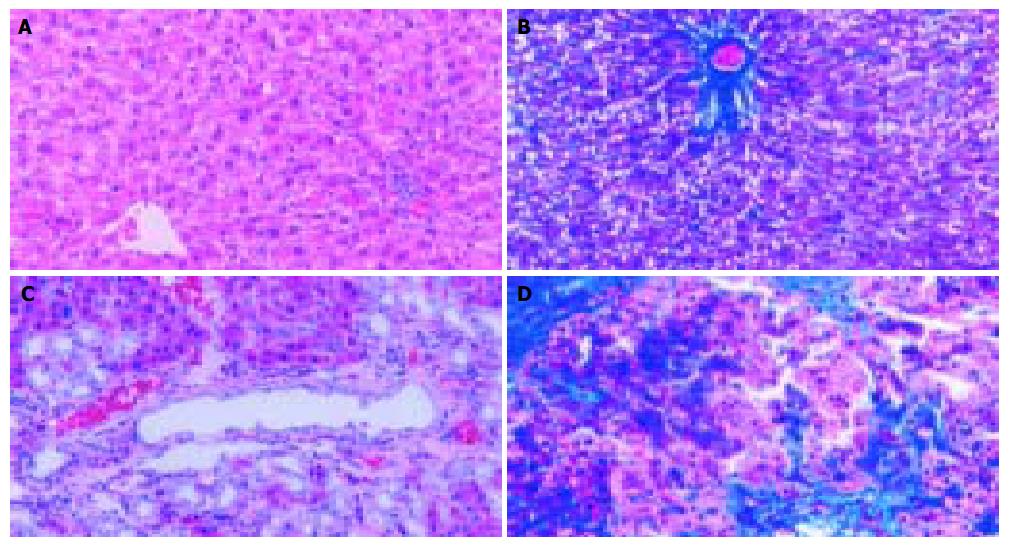
Figure 1 Histopathological changes in liver tissue (100 × ) A: Normal hepatic lobular architecture in sham operation group (HE); B: Few ECM deposition in sham operation group (Massson trichome); C: Extensive ductular proliferation and ECM deposition 4 wk after BDL (HE); D: Extensive connective tissue deposition 4 wk after BDL (Massson trichome).
Figure 2 α -SMA protein expression in liver tissue stained by immunohistochemistry (SP 200 × ) A: Few α -SMA expressions in sham operation group; B: Positive cells of α -SMA resided in portal ducts, fiber septa, perisinuses and around proliferated bile ducts after 2 wk BDL; C: Positively stained areas of α -SMA expression in model groups 1 to 4 wk after common bile duct ligation.
Figure 3 FAK protein expression in liver tissue stained by immunohistochemistry (SP 200 × ) A: FAK protein expression in sham operation group; B: FAK protein expression 2 wk after BDL; C: Time course of FAK expression in hepatic fibrogenesis stained by immunohistochemistry.
Figure 4 RT-PCR analysis of mRNA encoding FAK in hepatic fibrogenesis A: RT-PCR analysis of mRNA encoding FAK in hepatic fibrogenesis at different time points.
Lane 1: sham operation group; lane 2: BDL 2 h; lane 3: BDL 6 h; lane 4: BDL 2 d; lane 5: BDL 1 wk; lane 6: BDL 2 wk; lane 7: BDL 3 wk; lane 8: BDL 4 wk; lane 9: Marker B: Band intensities were quantified by densitometry. FAK/β -actin quotient indicated the relative expression of FAK.
- Citation: Jiang HQ, Zhang XL, Liu L, Yang CC. Relationship between focal adhesion kinase and hepatic stellate cell proliferation during rat hepatic fibrogenesis. World J Gastroenterol 2004; 10(20): 3001-3005
- URL: https://www.wjgnet.com/1007-9327/full/v10/i20/3001.htm
- DOI: https://dx.doi.org/10.3748/wjg.v10.i20.3001


