Copyright
©The Author(s) 2004.
World J Gastroenterol. Oct 15, 2004; 10(20): 2972-2978
Published online Oct 15, 2004. doi: 10.3748/wjg.v10.i20.2972
Published online Oct 15, 2004. doi: 10.3748/wjg.v10.i20.2972
Figure 1 Transient expression of E2-661 in mammalian cells.
A: Schematic representation of plasmids encoding E2-661. HBV preS1 (21-47) tag and HCV E2-661 (384-661) signal peptide are indicated. Numbers refer to amino acids of the HCV polyprotein. B: Western blot analysis of E2-661 expressed in mammalian cells with a rabbit polyclonal anti-E2 antibody RE2116. Lanes on the left of all blots were transfected with the empty vector while those on the right were transfected with pSecTagB/sE2. 1-2, BHK-21; 3-4, HeLa; 5-6, Huh7 and 7-8, HepG2. E2-661 was indi-cated by arrowhead.
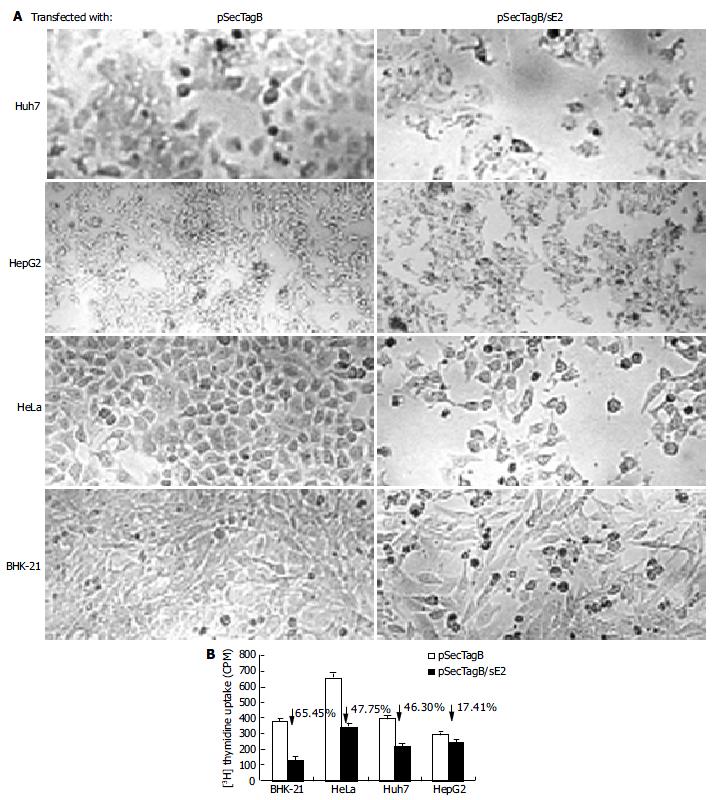
Figure 2 Reduced cell proliferation in E2 expressing cells.
A: Morphology of Huh7, HepG2, HeLa, BHK-21 cells 48 h after transfection with pSecTagB or pSecTagB/sE2 (original magnification 40 × ). B: Reduced 3H thymidine uptake by E2 expressing cells. P < 0.05 betweer all the cells tested.
Figure 3 Apoptosis induced by transient expression of E2.
A: Hoechst staining of BHK-21, HeLa, Huh7 and HepG2 cells 48 h after transfection with pSecTagB or pSecTagB/sE2. Note the bright nuclei among cells transfected with pSecTagB/sE2. Photograph is a representative experiment repeated three times (original magnification 400 × ). B: Flow cytometry analysis of PI stained cells 48 h after transfection with pSecTagB or pSecTagB/sE2. The percentage of cells with hypodiploid genomic DNA are indicated on each of the histogram. Results were a representative experiment repeated twice.
Figure 4 Expression of E2-661 in CHO/sS1E2 cells.
A: Immunofluorescence of E2 in CHO/sS1E2 cells analyzed with a mono-clonal anti-preS1 antibody 125E11 (original magnification 400 × ). B: Western blot analysis of the E2 products from CHO/sS1E2 cells. Cell lysates and proteins precipitated from culture medium were analyzed with anti-E2 polyclonal antibody RE2116 after N-glycosidase treatment. Lanes 1, 2, 5, 6: cell lysates from CHO cells; lanes 3, 4, 7, 8: cell lysates from CHO/sS1E2 cells; lanes 9, 10, 13, 14: culture medium from CHO cells; lanes 11, 12, 15, 16: culture medium from CHO/sS1E2 cells; lanes 1, 3, 9, 11: samples incubated with Endo H digestion buffer; lanes 2, 4, 10, 12: samples digested with Endo H; lanes 5, 7, 13, 15: samples incubated with PNGase F digestion buffer; lanes 6, 8, 14, 16, samples digested with PNGase F.
Figure 5 Reduced cell proliferation in CHO/sS1E2 cells.
A: Morphology of CHO and CHO/sS1E2 cells (original magnification 40 × ). B: Reduced 3H thymidine uptake by CHO/sS1E2 cells. CHO and CHO/sS1E2 cells were subjected to 3H thymidine uptake assay 24 h after seeding. Each sample was done in quadruplicates. The differences in 3H incorporation between CHO and CHO/sS1E2 cells were significant (P < 0.001).
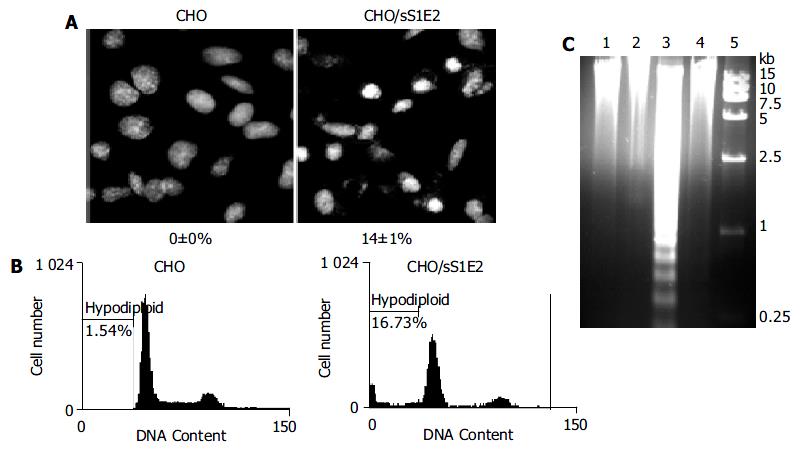
Figure 6 Apoptosis of CHO/sS1E2 cells.
A: Hoechst staining of CHO and CHO/sS1E2 cells 24 h after seeding. Photograph is a representative experiment repeated three times (original magnification 400 × ). The percentage of condensed and fragmented nuclei is indicated at the bottom of each photo. Numbers are presented as mean ± SD. B: Flow cytometry analysis of PI stained cells 24 h after seeding. The percentage of cells with hypodiploid genomic DNA is indicated on each of the histogram. Results were a representative experiment repeated twice. C: Fragmentation of CHO/sS1E2 cell DNA. Lane 1: CHO cells 48 h post-seeding; lane 2: CHO cells freshly seeded; lane 3: CHO/sS1E2 cells 48 h post-seeding; lane 4: CHO/sS1E2 cells freshly seeded; lane 5: DNA size marker.
- Citation: Zhu LX, Liu J, Xie YH, Kong YY, Ye Y, Wang CL, Li GD, Wang Y. Expression of hepatitis C virus envelope protein 2 induces apoptosis in cultured mammalian cells. World J Gastroenterol 2004; 10(20): 2972-2978
- URL: https://www.wjgnet.com/1007-9327/full/v10/i20/2972.htm
- DOI: https://dx.doi.org/10.3748/wjg.v10.i20.2972


