Copyright
©The Author(s) 2004.
World J Gastroenterol. Oct 1, 2004; 10(19): 2779-2784
Published online Oct 1, 2004. doi: 10.3748/wjg.v10.i19.2779
Published online Oct 1, 2004. doi: 10.3748/wjg.v10.i19.2779
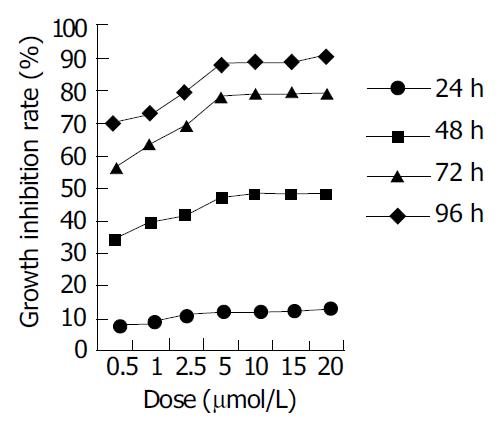
Figure 1 MTT assay of EC9706 cells after exposed to MG-132.
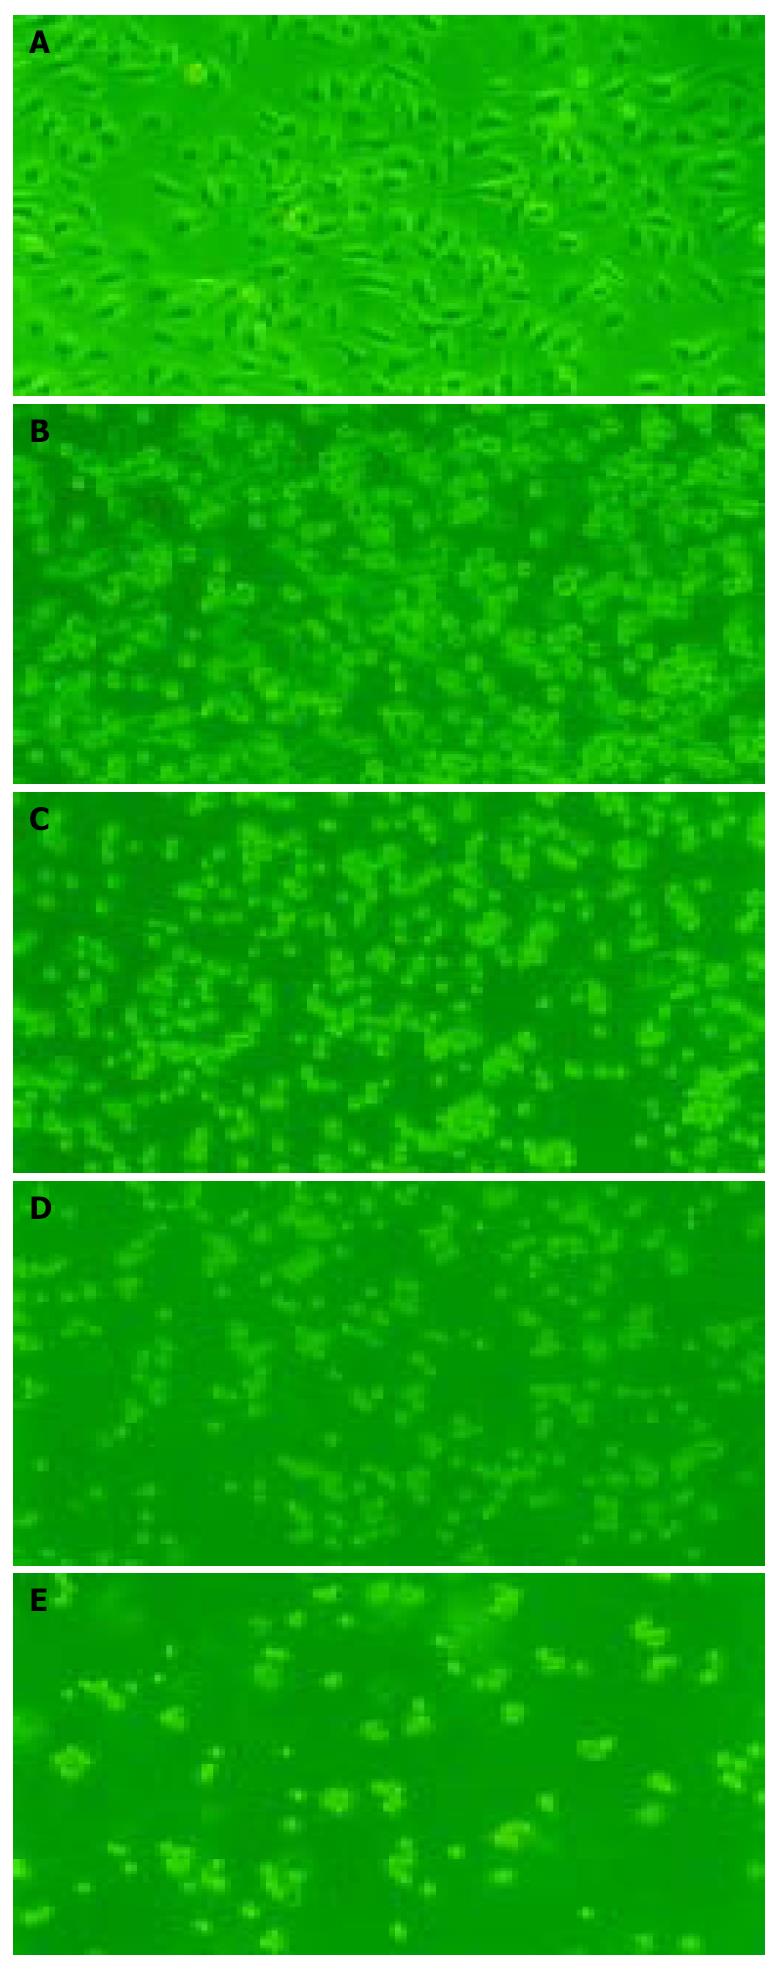
Figure 2 Morphologic changes of EC9706 cells observed un-der microscope after treated with 5 μmol/L of MG-132.
A: control group; B: EC9706 cells treated with MG-132 for 24 h; C: EC9706 cells treated with MG-132 for 48 h; D: EC9706 cells treated with MG-132 for 72 h; E: EC9706 cells treated with MG-132 for 96 h (× 200).
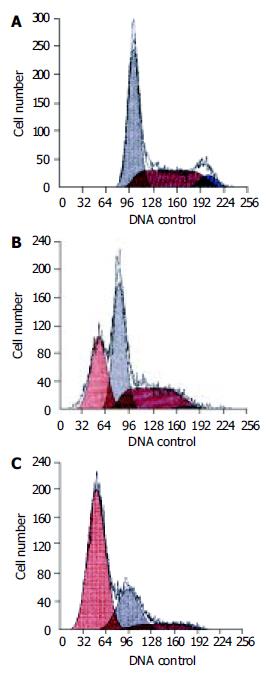
Figure 3 Cell cycle and apoptosis of EC9706 cells exposed to 5 μmol/L of MG-132.
A: control group. Apoptotic sub-G1 peak was not found; B: EC9706 cells exposed to MG-132 for 48 h. The ratio of apoptotic cells was 31.7%; C: EC9706 cells ex-posed to MG-132 for 96 h. The ratio of apoptotic cells was 66.4%.
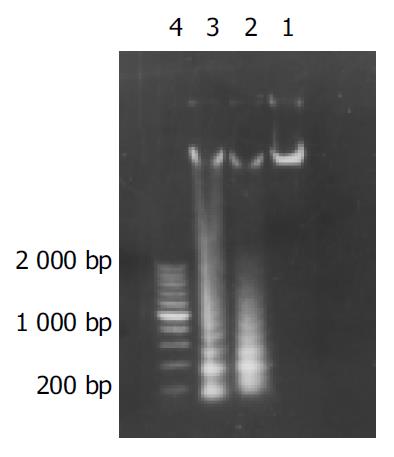
Figure 4 Results of DNA agarose electrophoresis.
Lane1: con-trol group; Lane 2: EC9706 cells exposed to 5 μmol/L of MG-132 for 48 h; Lane 3: EC9706 cells exposed to 5 μmol/L of MG-132 for 96 h; Lane 4: 200, 400, 600, 800, 1000, 1200, 1400, 1600, 1800, 2000 bp ladder markers.
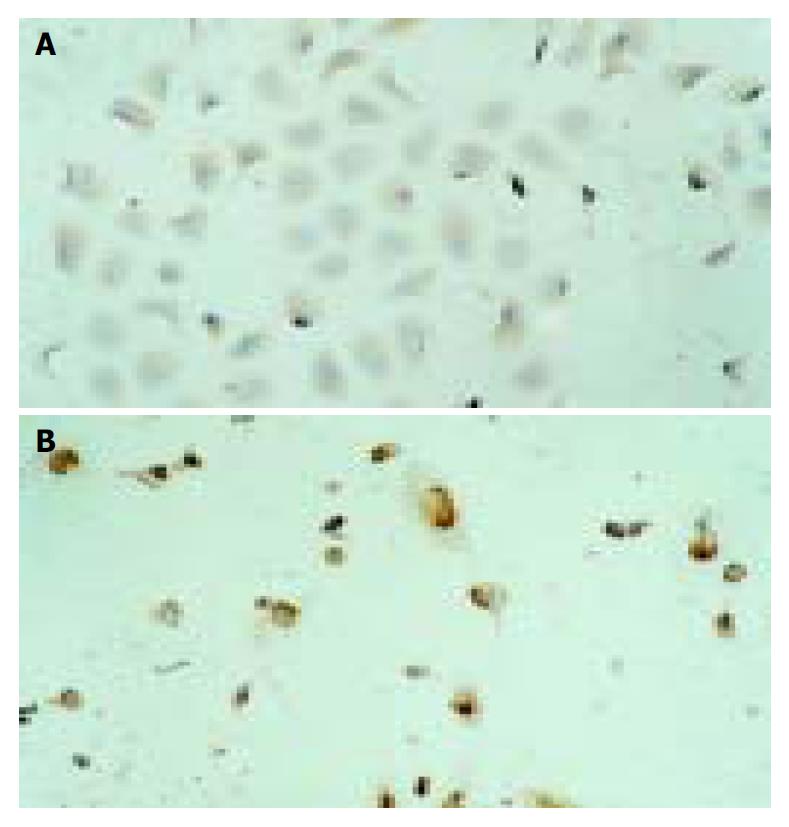
Figure 5 Results of immunohistochemical staining of EC9706 cells.
A: control group. Immunohistochemical staining of p27kip1 protein located in cytoplasm of EC9706 cells; B: MG-132 group.
- Citation: Zhang WG, Yu JP, Wu QM, Tong Q, Li SB, Wang XH, Xie GJ. Inhibitory effect of ubiquitin-proteasome pathway on proliferation of esophageal carcinoma cells. World J Gastroenterol 2004; 10(19): 2779-2784
- URL: https://www.wjgnet.com/1007-9327/full/v10/i19/2779.htm
- DOI: https://dx.doi.org/10.3748/wjg.v10.i19.2779


