Copyright
©The Author(s) 2004.
World J Gastroenterol. Sep 15, 2004; 10(18): 2706-2710
Published online Sep 15, 2004. doi: 10.3748/wjg.v10.i18.2706
Published online Sep 15, 2004. doi: 10.3748/wjg.v10.i18.2706
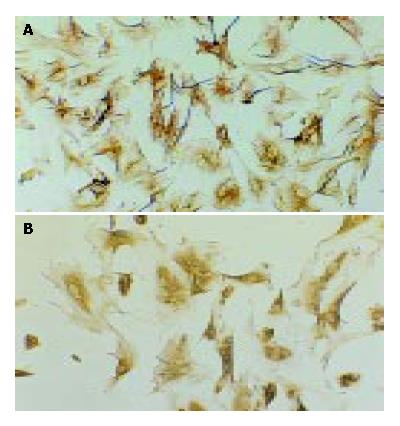
Figure 1 Desmin and α-SMA immunocytochemistry (SP, origi-nal magnification: × 100).
A: Desmin immunocytochemistry of HSCs 7 d after isolation; B: α-SMA immunocytochemistry of HSCs 7 after isolation.
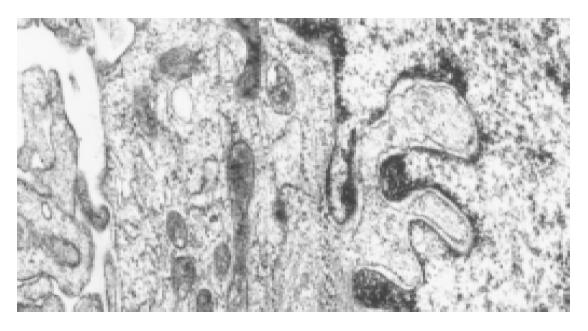
Figure 2 Activated HSCs under the electron microscope.
The myofilament can be seen in the cytoplasm as the arrow point shows.
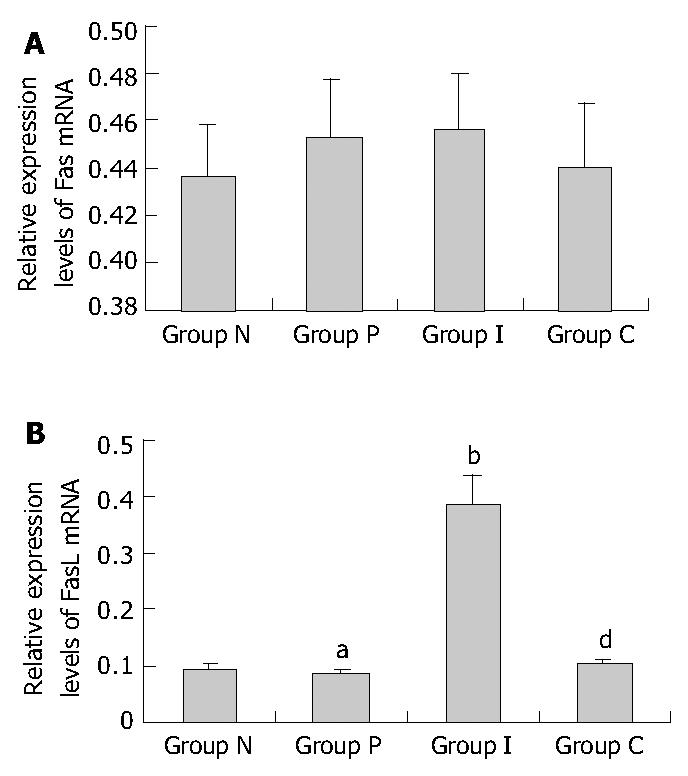
Figure 3 Relative Fas/FasL mRNA expression levels in HSCs of different groups assessed by RT-PCR.
A: Relative Fas mRNA expression levels (P > 0.05 between random two groups.); B: Relative FasL mRNA expression levels (aP > 0.05 vs group N, bP < 0.01 vs group N, dP < 0.01 vs group I.); group N: Normal group as control; group P: PDGF treated group; group I: IL-10 treated group; group C: Combined PDGF and IL-10 treatment group.
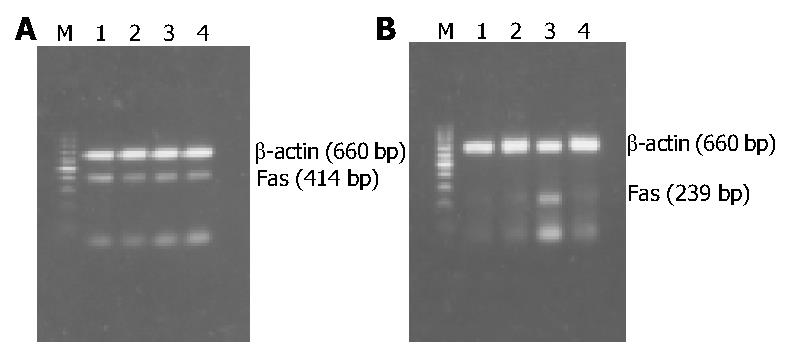
Figure 4 RT-PCR results of Fas/FasL mRNA expression in HSCs of different groups.
A: RT-PCR results of Fas mRNA expression; B: RT-PCR results of FasL mRNA expression; M: 100 bp DNA ladder (upper to lower: 1000, 900, 800, 700, 600, 500, 400, 300, 200, and 100 bp); Lane 1: Normal group as control; Lane 2: PDGF treatment group; Lane 3: IL-10 treatment group; Lane 4: Combined PDGF and IL-10 treatment group.
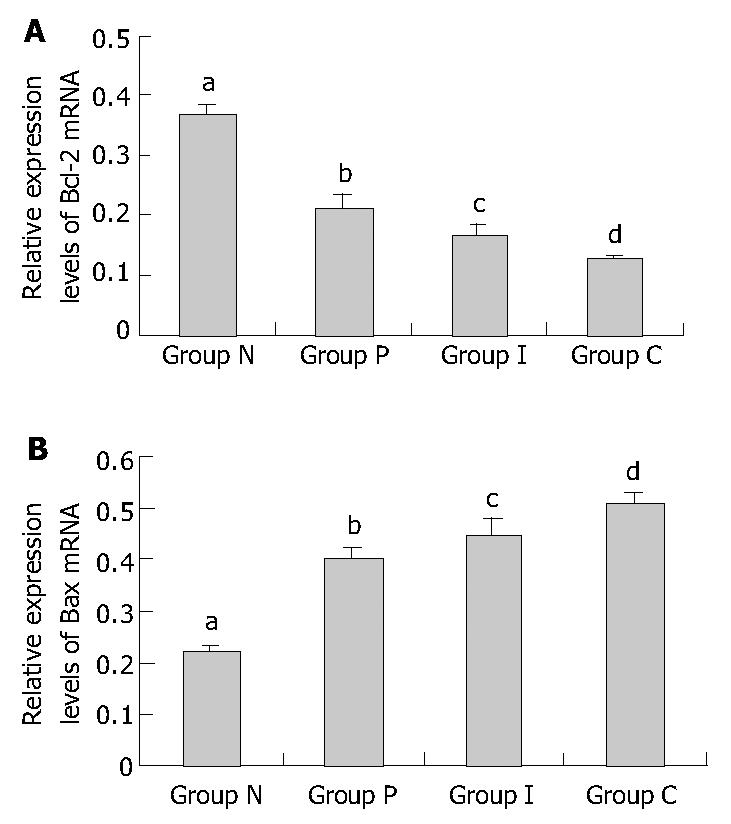
Figure 5 Relative Bcl-2/Bax mRNA expression levels in HSCs of different groups assessed by RT-PCR.
A: Relative Bcl-2 mRNA expression levels (bP < 0.01 vs group P, group I and group C, respectively; aP > 0.05 vs group I, cP > 0.05 vs group C, dP < 0.01 vs group P.). B: Relative Bax mRNA expression levels (bP < 0.01 vs group P, group I and group C, respectively; aP > 0.05 vs group I, cP = 0.045 < 0.05 vs group C, dP < 0.01 vs group P.). Group N: Normal group as control; group P: PDGF treated group; group I: IL-10 treated group; group C: Combined PDGF and IL-10 treatment group.
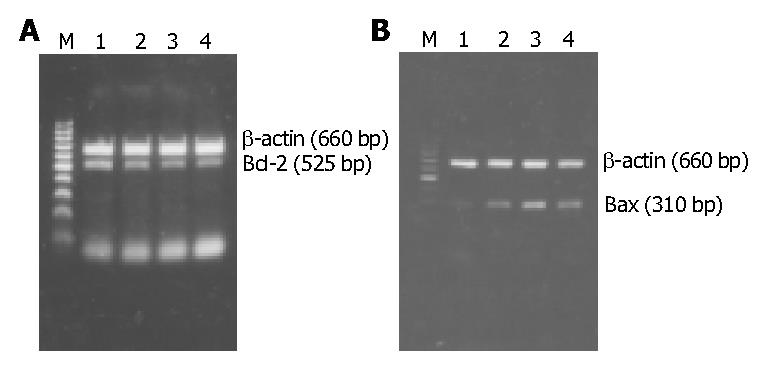
Figure 6 RT-PCR results of Bcl-2/Bax mRNA expression in HSCs of different groups.
A: Bcl-2 mRNA expression. B: Bax mRNA expression. M: 100 bp DNA ladder (upper to lower: 1000, 900, 800, 700, 600, 500, 400, 300, 200, and 100 bp); Lane 1: Normal group as control; Lane 2: PDGF treatment group; Lane 3: IL-10 treatment group; Lane 4: Combined PDGF and IL-10 treatment group.
-
Citation: Wang XZ, Zhang SJ, Chen YX, Chen ZX, Huang YH, Zhang LJ. Effects of platelet-derived growth factor and interleukin-10 on Fas/Fas-ligand and Bcl-2/Bax mRNA expression in rat hepatic stellate cells
in vitro . World J Gastroenterol 2004; 10(18): 2706-2710 - URL: https://www.wjgnet.com/1007-9327/full/v10/i18/2706.htm
- DOI: https://dx.doi.org/10.3748/wjg.v10.i18.2706


