Copyright
©The Author(s) 2004.
World J Gastroenterol. Sep 15, 2004; 10(18): 2680-2689
Published online Sep 15, 2004. doi: 10.3748/wjg.v10.i18.2680
Published online Sep 15, 2004. doi: 10.3748/wjg.v10.i18.2680
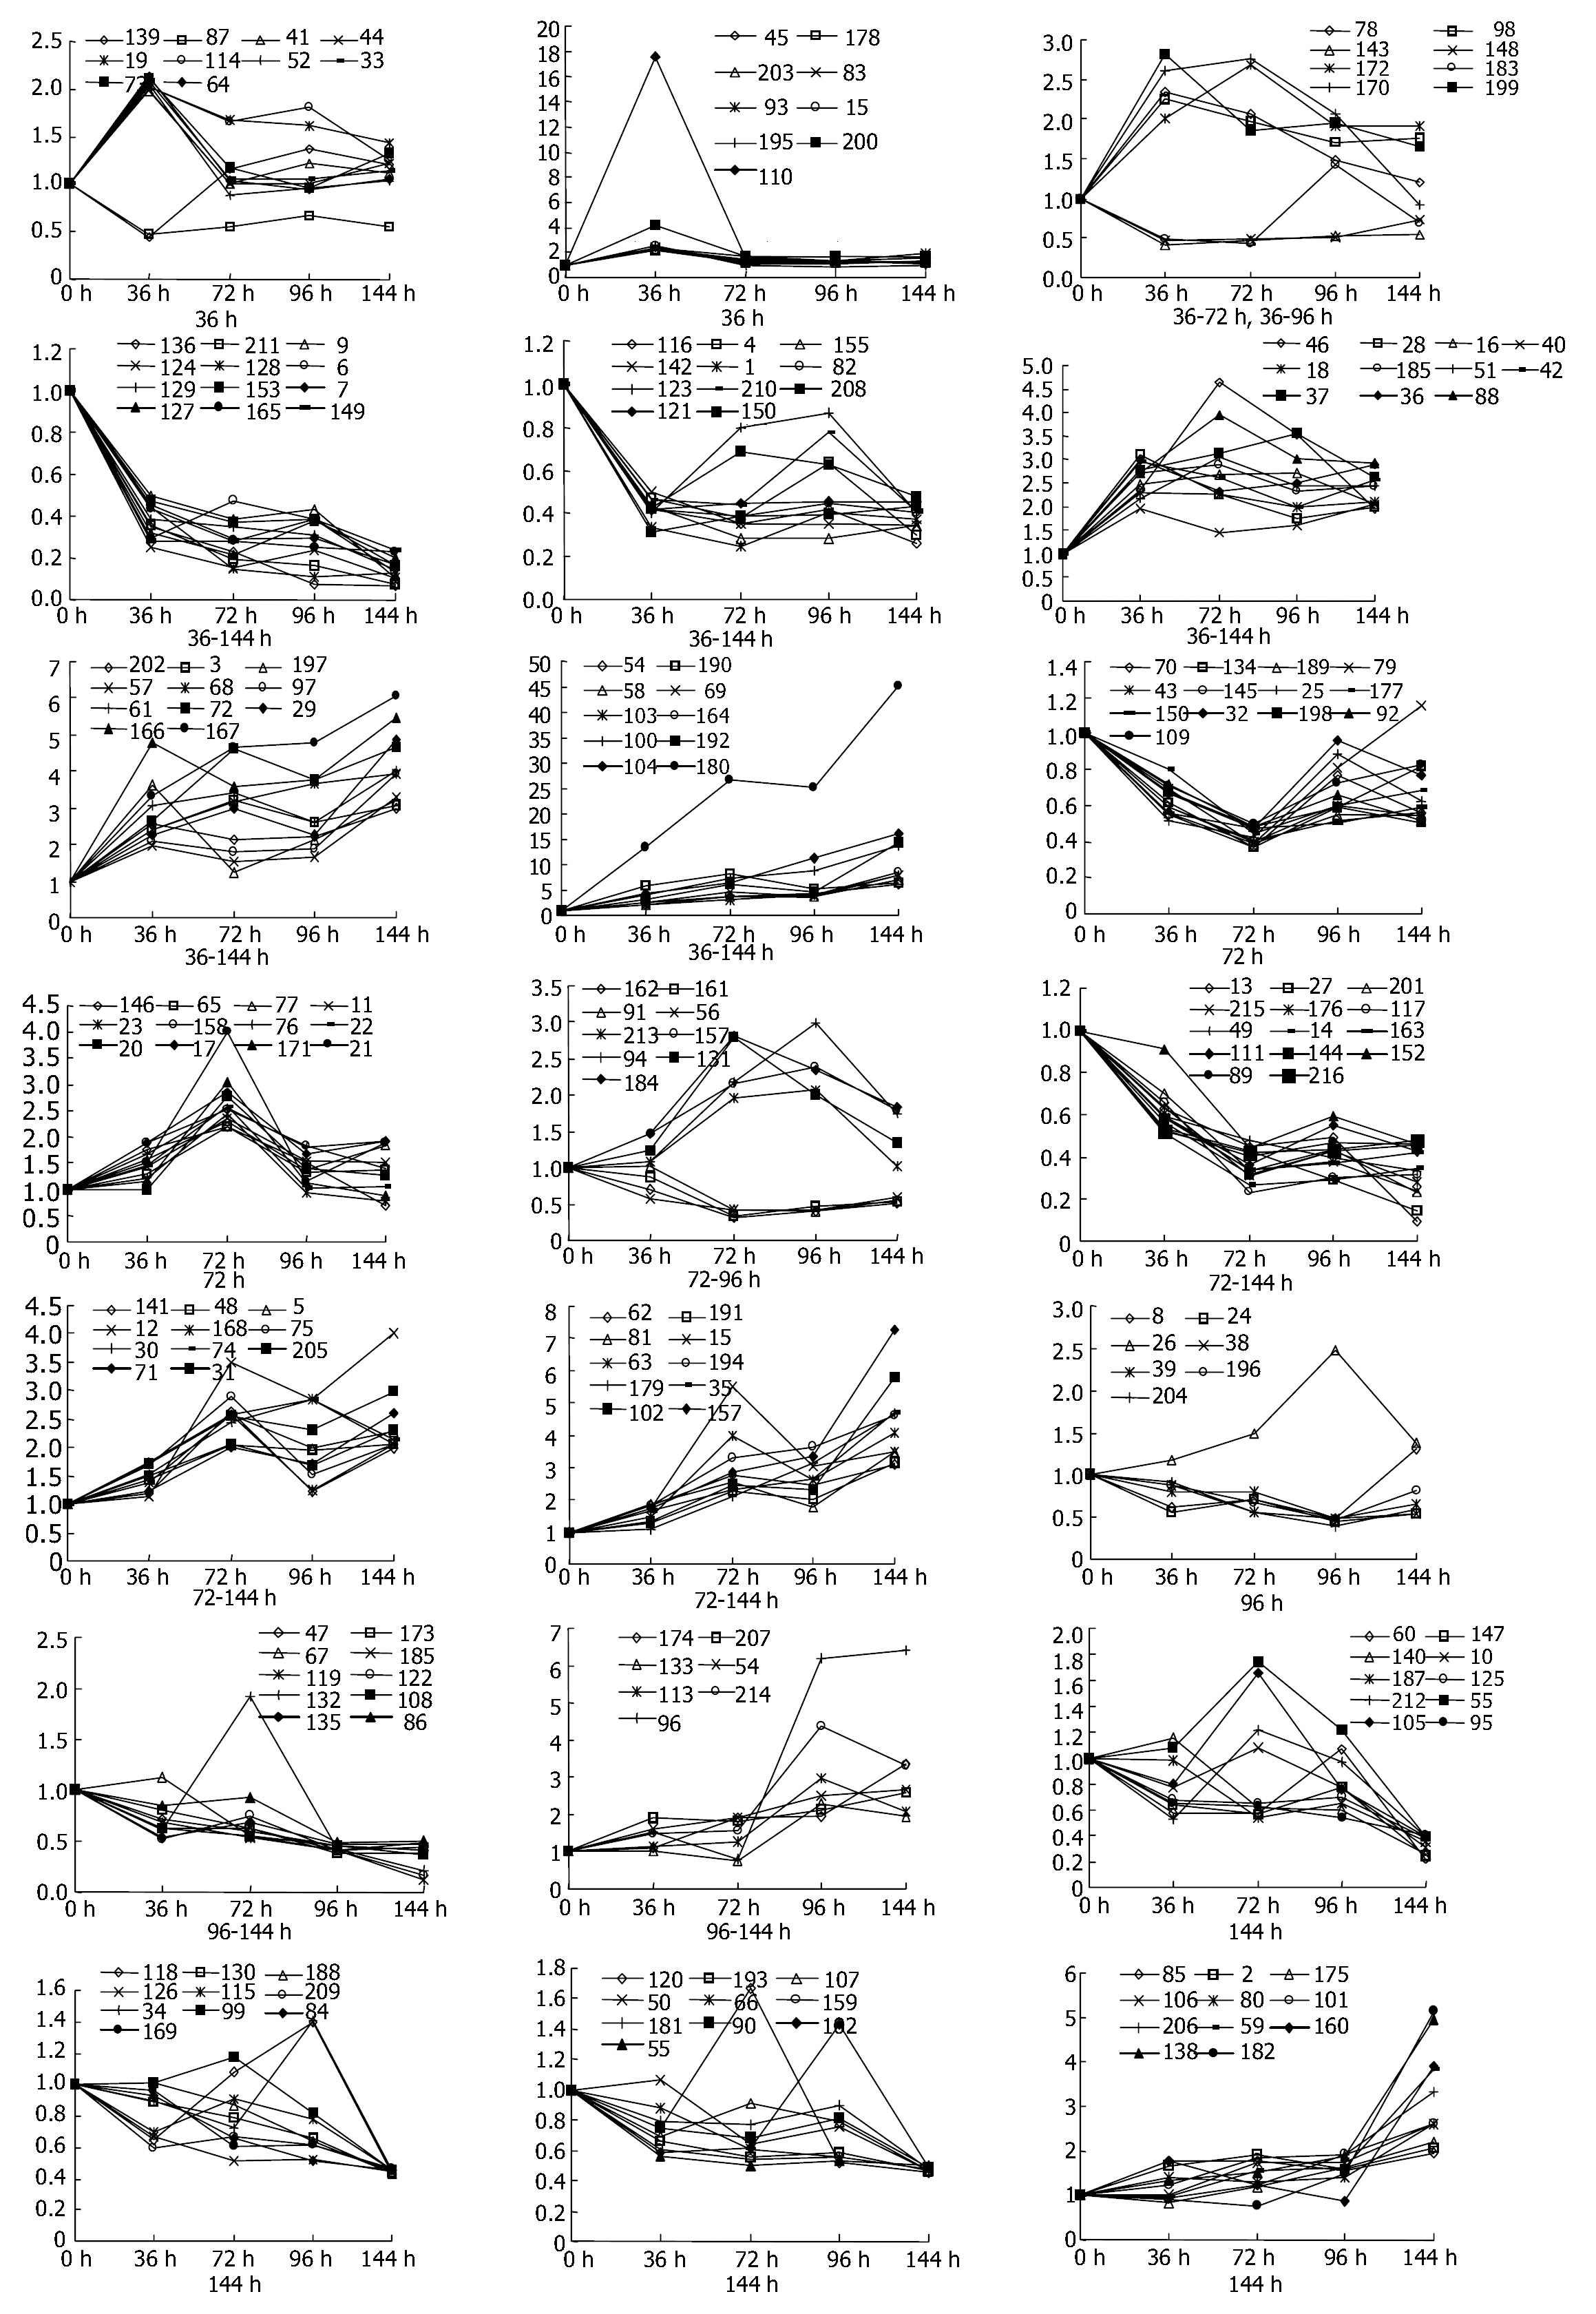
Figure 1 Gene expression differences in the regenerating rat liver of 0-36-72-96-144 h SISPH.
Figure 2 Expression level of genes in the regenerating rat liver of 0-36-72-96-144 h SISPH.
Figure 3 Cluster analysis of 216 elements.
A: The difference of their intensity was identified more than two-fold at least at one time point. B: A hierarchical clustering of five time points indicated that the genes at these time points hardly had a common expression profile.
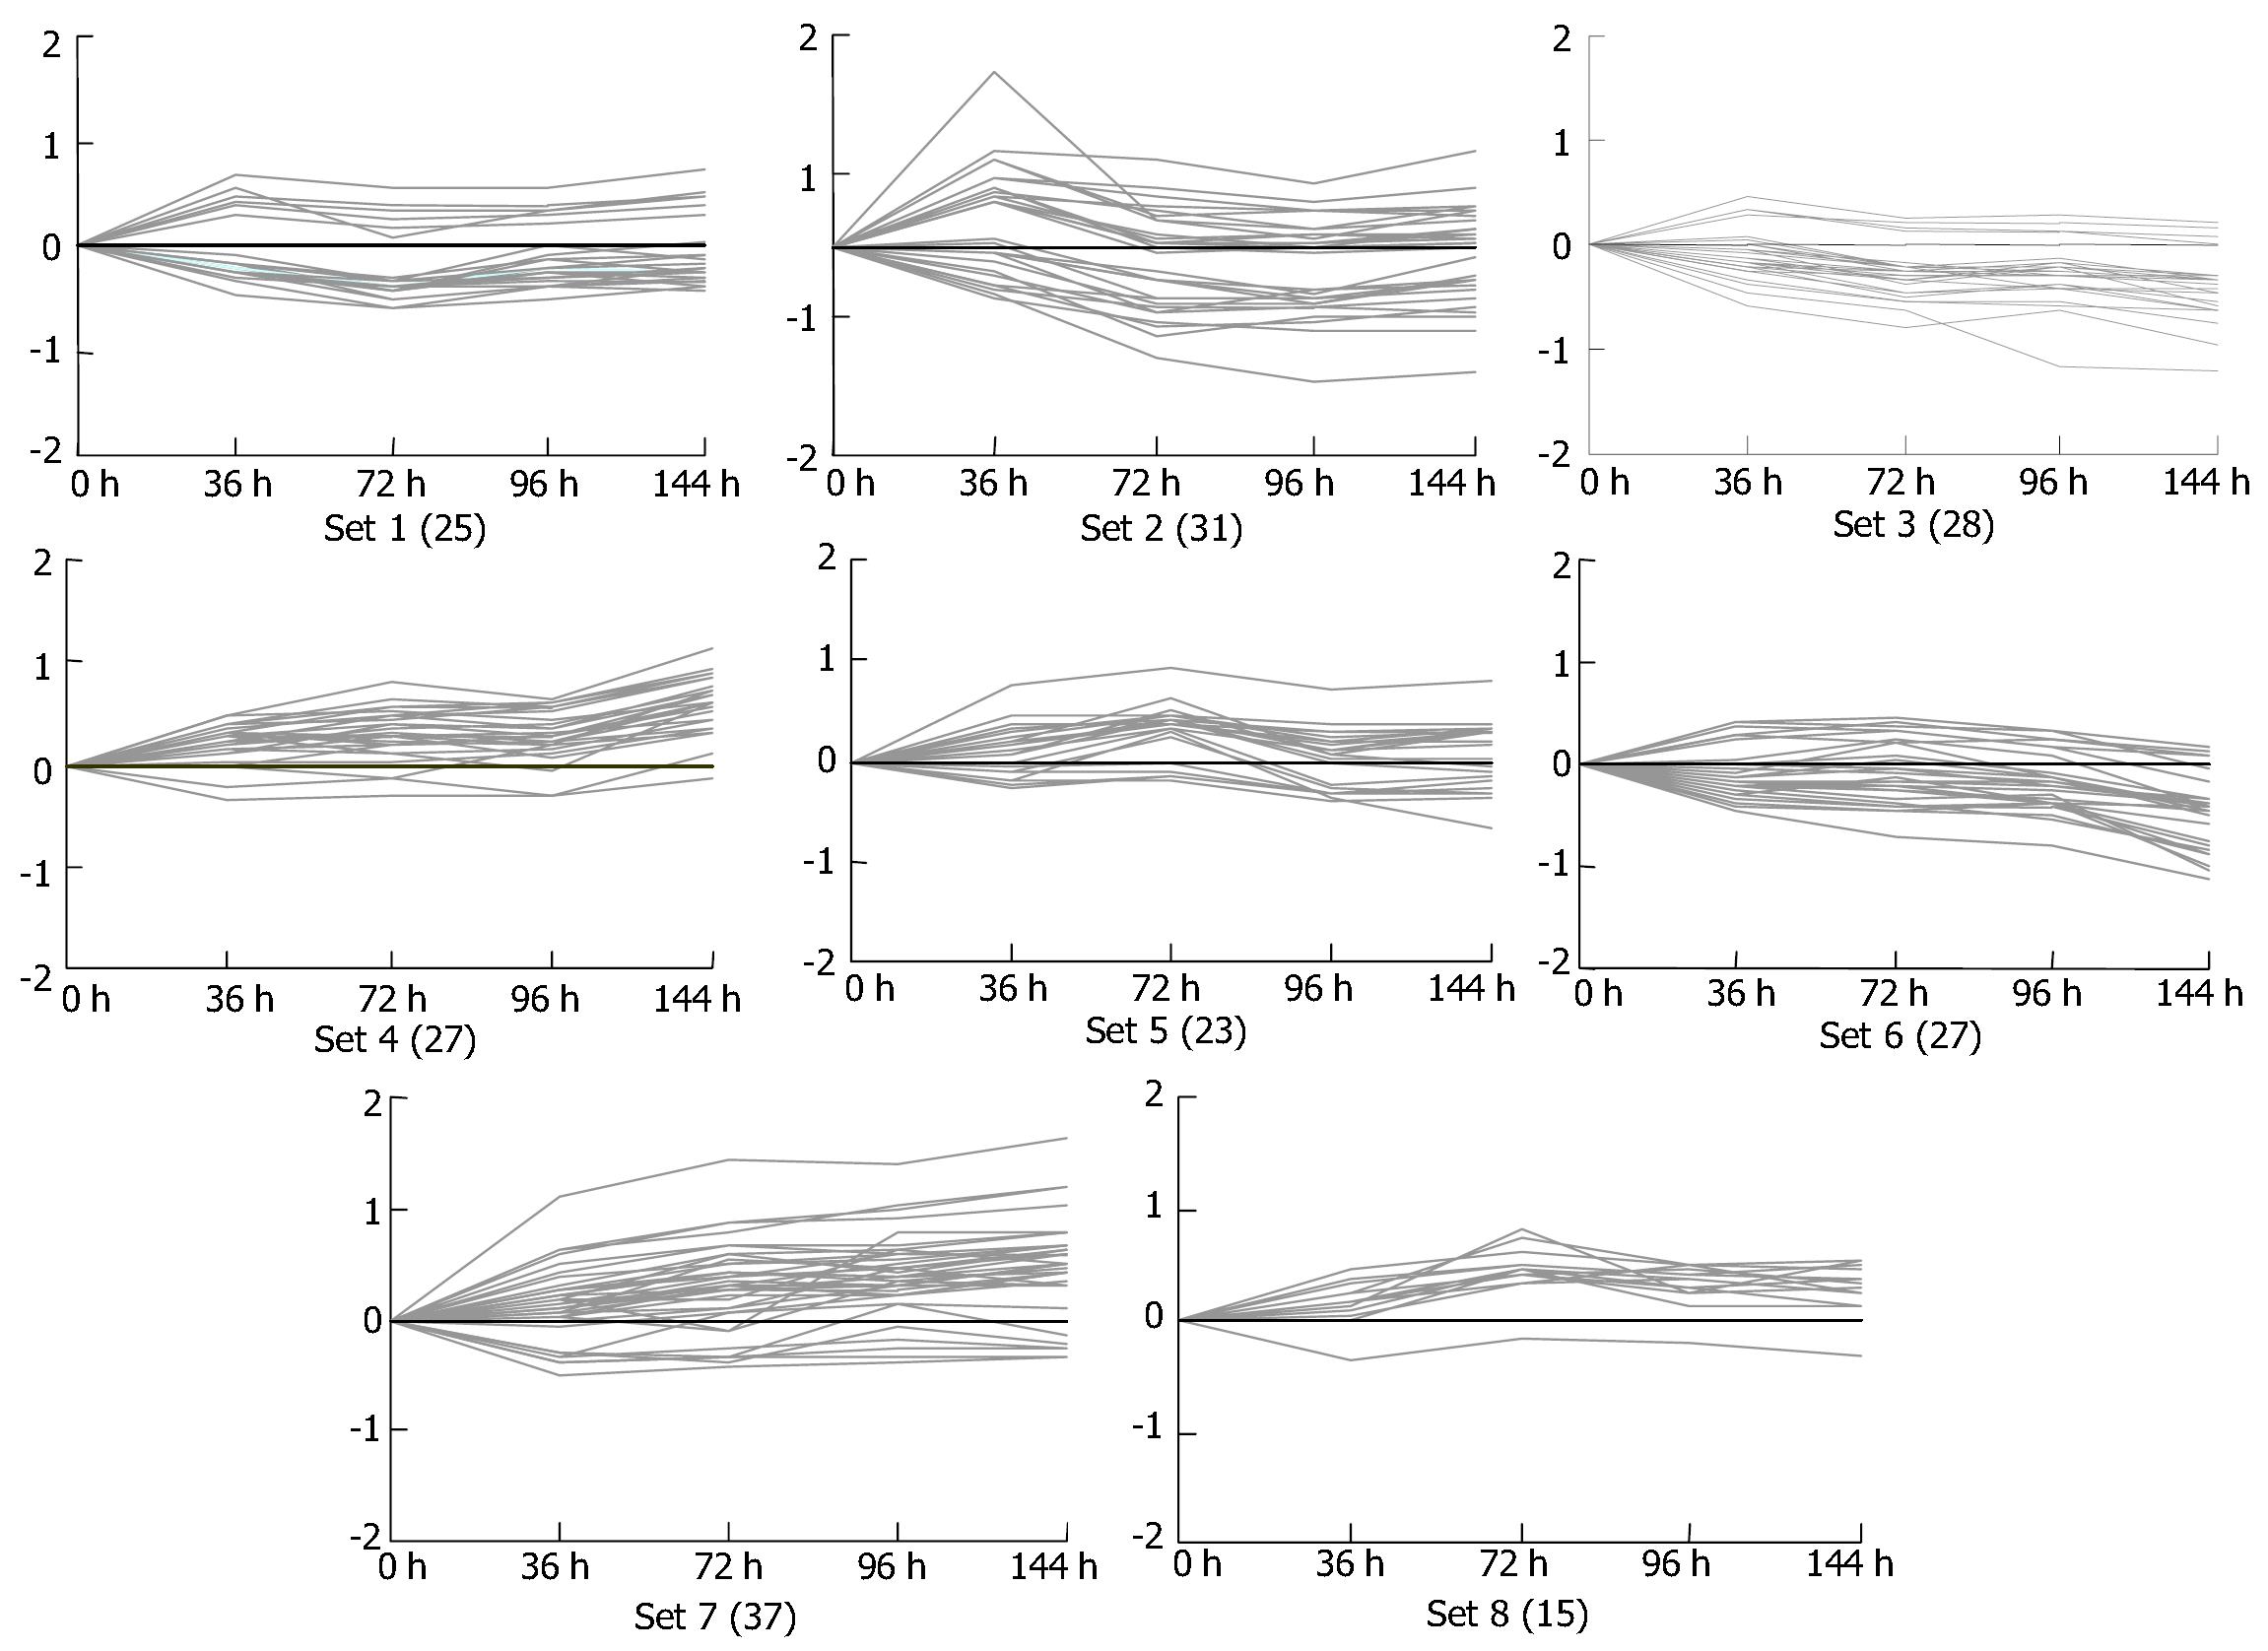
Figure 4 Cluster analysis of gene expression profiles identified by cDNA microarray.
These genes were classified into 8 clusters by the κ-means method.
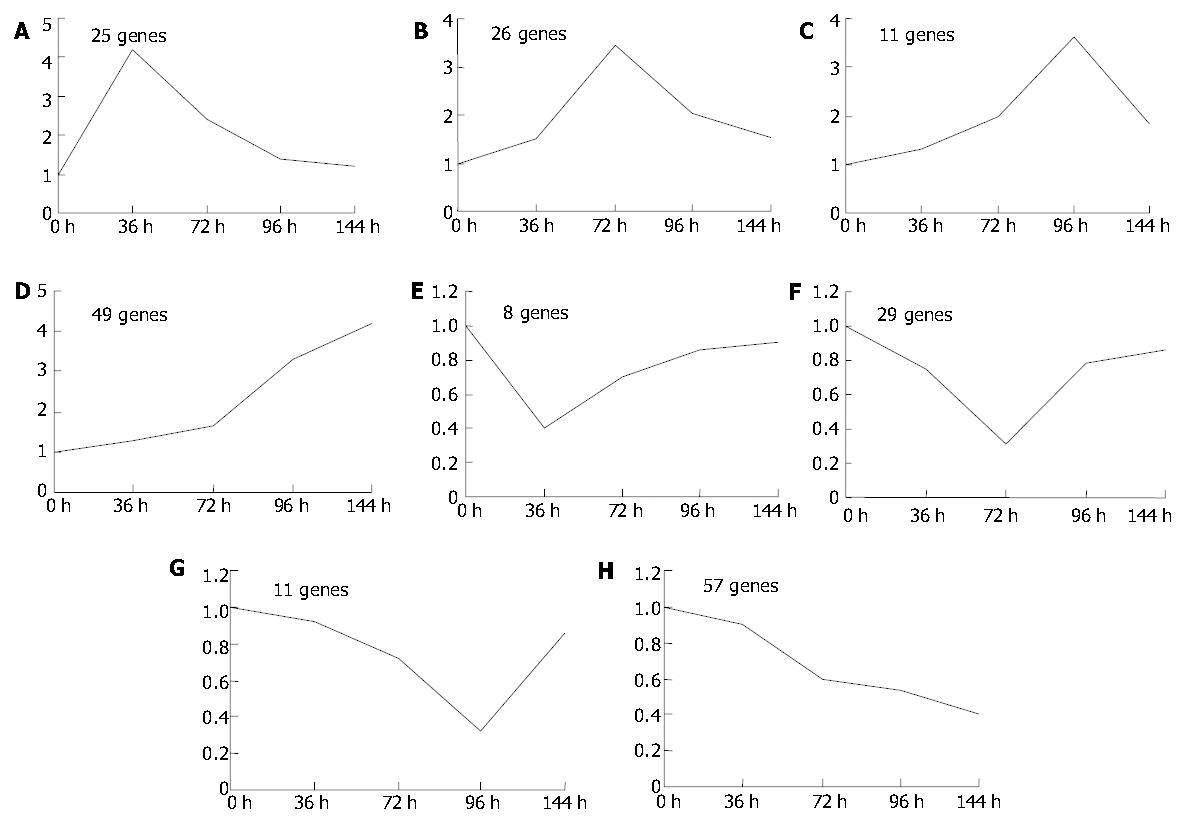
Figure 5 Category of the 216 elements.
Based on the results of the cluster analysis, eight distinct temporal patterns were designated. A: Immediate induction, B: Middle induction, C: Late induction, D: Consistent induction, E: Immediate suppression, F: Middle suppression, G: Late suppression, H: Consistent suppression.
- Citation: Xu CS, Zhang AS, Han HP, Yuan JY, Chang CF, Li WQ, Yang KJ, Zhao LF, Li YC, Zhang HY, Rahman S, Zhang JB. Gene expression differences of regenerating rat liver in a short interval successive partial hepatectomy. World J Gastroenterol 2004; 10(18): 2680-2689
- URL: https://www.wjgnet.com/1007-9327/full/v10/i18/2680.htm
- DOI: https://dx.doi.org/10.3748/wjg.v10.i18.2680


