Copyright
©The Author(s) 2004.
World J Gastroenterol. Sep 15, 2004; 10(18): 2657-2660
Published online Sep 15, 2004. doi: 10.3748/wjg.v10.i18.2657
Published online Sep 15, 2004. doi: 10.3748/wjg.v10.i18.2657
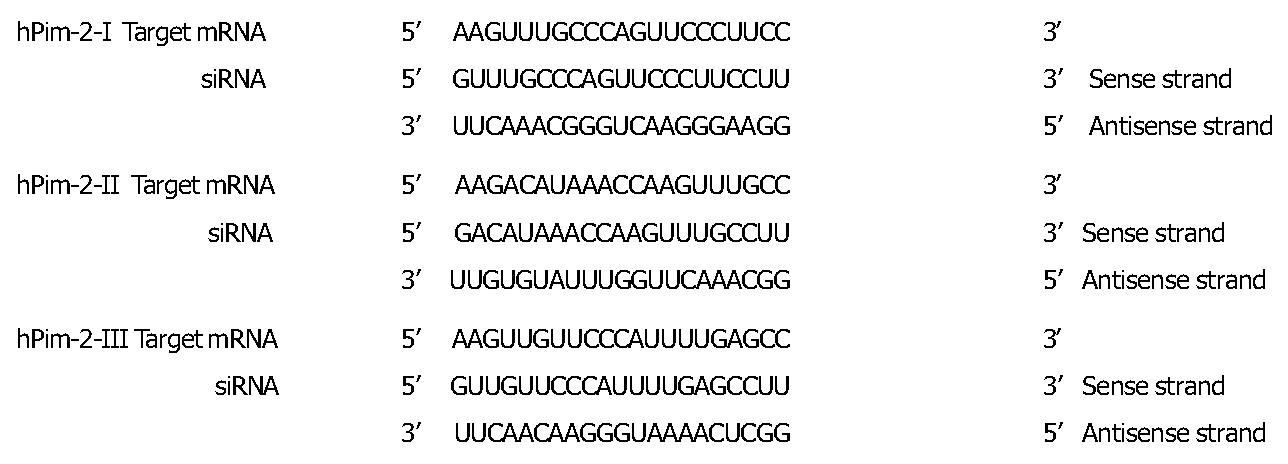
Figure 1 Sequences of 21-nt siRNA duplex that were used to target at hPim-2.
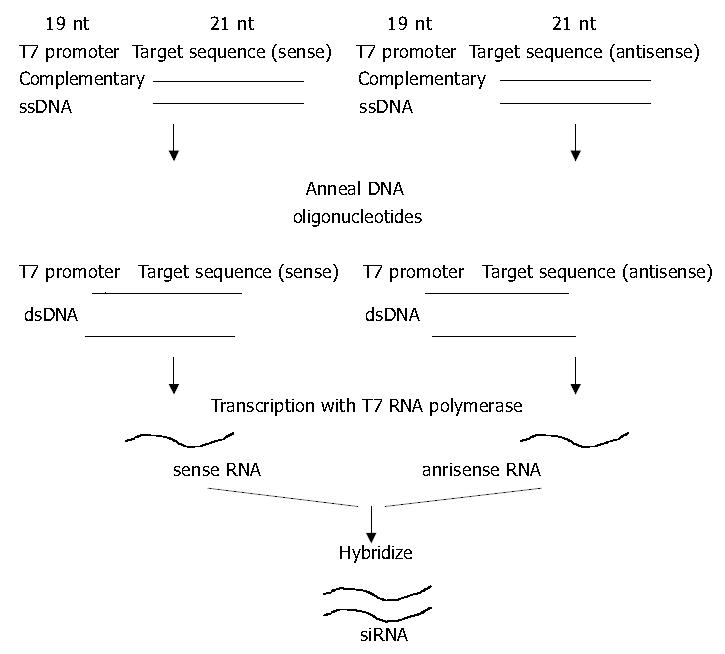
Figure 2 Strategy to generate T7 siRNA.
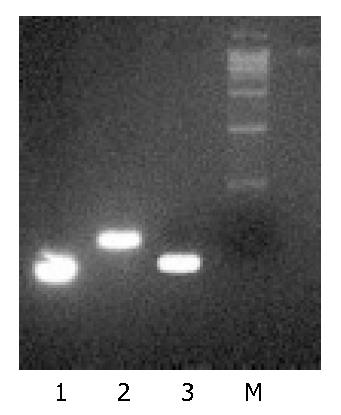
Figure 3 Lane 1: T7in vitro transcribed single-strand RNA, Lane 2: annealed double-strand DNA template and Lane 3: hybridized double-strand small interference RNA.
Figure 4 Inhibitory effects of siRNA on mRNA level of hPim-2.
A: Electrophoresis of RT-PCR products of hPim-2 gene and β-actin gene in colon cancer cells transfected with siRNA I,II,III. B: Quantitation of inhibitory percentage of hPim-2 mRNA in transfected cells. Each level of PCR product of hPim-2 gene was. quantitated and normalized to the level of β-actin. Inhibitory rate was calculated by comparing to the control cells. The results were expressed as means ± SD from independent experiments. P < 0.05 vs the cells transfected with lipofectamine alone.
Figure 5 Inhibitory effects of siRNA on protein level of hPim-2.
A: Western blot analysis of hPim-2 protein in colon cancer cells transfected with siRNA I, II, III. B: inhibitory percentage of hPim-2 protein in transfected cells compared to the control cells. Each level of hPim-2 protein was quantitated. Inhibitory rate was calculated by comparing to the control cells. The results were expressed as mean ± SD from independent experiments. P < 0.05 vs the cells transfected with lipofectamine alone.
- Citation: Zhang SQ, Du QY, Ying Y, Ji ZZ, Wang SQ. Polymerase synthesis and potential interference of a small-interfering RNA targeting hPim-2. World J Gastroenterol 2004; 10(18): 2657-2660
- URL: https://www.wjgnet.com/1007-9327/full/v10/i18/2657.htm
- DOI: https://dx.doi.org/10.3748/wjg.v10.i18.2657


