Copyright
©The Author(s) 2004.
World J Gastroenterol. Sep 1, 2004; 10(17): 2553-2556
Published online Sep 1, 2004. doi: 10.3748/wjg.v10.i17.2553
Published online Sep 1, 2004. doi: 10.3748/wjg.v10.i17.2553
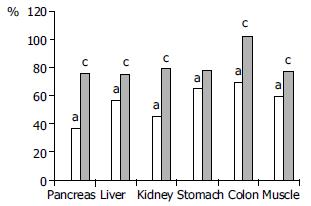
Figure 1 Microcirculatory parameters of pancreas, liver, kidney, stomach, colon and muscle (Mean values).
Legend: grey bars: - control, white bars: - AP, black bars: - AP + heparin, aP < 0.05 vs control, cP < 0.05 vs AP group.
- Citation: Dobosz M, Mionskowska L, Hać S, Dobrowolski S, Dymecki D, Wajda Z. Heparin improves organ microcirculatory disturbances in caerulein-induced acute pancreatitis in rats. World J Gastroenterol 2004; 10(17): 2553-2556
- URL: https://www.wjgnet.com/1007-9327/full/v10/i17/2553.htm
- DOI: https://dx.doi.org/10.3748/wjg.v10.i17.2553


