Copyright
©The Author(s) 2004.
World J Gastroenterol. Sep 1, 2004; 10(17): 2519-2523
Published online Sep 1, 2004. doi: 10.3748/wjg.v10.i17.2519
Published online Sep 1, 2004. doi: 10.3748/wjg.v10.i17.2519
Figure 1 Simplified diagram of biomaterial test machine.
1: Linear stage, 2: Torque transducer, 3: Organ bath, 4: Specimen, 5: Force transducer, 6: Motor for axial rotation, 7: Pressure transducer, 8: Infusion channel, 9: Motor for linear stage, 10: Rails for linear stage, 11: CCD camera, 12: Plastic rod.
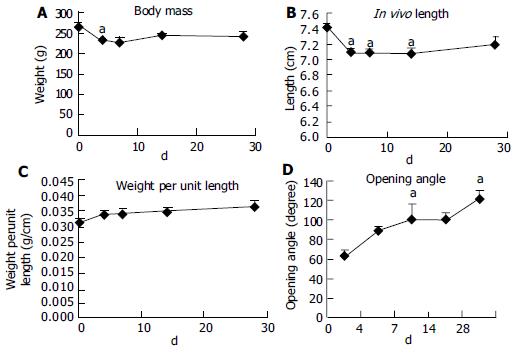
Figure 2 Changes of body mass and esophagus morphology and opening angle at zero-stress state in the process of diabetes development.
Dunner’s test result: significant difference vs normal control (aP < 0.05). A: Change of body mass, B: Change of in vivo length, C: Change of mass per unit length, D: Change of opening angle.
Figure 3 Change of elastic shear modulus in the process of diabetes development.
A: Change at λzz = 1.5 and various transmural pressure, B: Change at P = 1 kPa and various longitudinal stretch ratio.
Figure 4 A: Change of circumferential stress-strain relation in the course of diabetes development at λzz = 1.
5 and various transmural pressure. B: Change of longitudinal stress-strain relation in the course of diabetes development at P = 0.25 kPa and various longitudinal stretch ratio.
Figure 5 A: Circumferential stress-strain relation between muscle layer and mucosa layer in the process of inflation at a longitudinal stretch ratio of 1.
5. N: Normal control, D: 28 d of diabetes. B: Longitudinal stress-strain relation between muscle layer and mucosa layer in the process of elongation at a transmural pressure of 0.25 kPa. N: Normal control, D: 28 d of diabetes.
- Citation: Zeng YJ, Yang J, Zhao JB, Liao DH, Zhang EP, Gregersen H, Xu XH, Xu H, Xu CQ. Morphologic and biomechanical changes of rat oesophagus in experimental diabetes. World J Gastroenterol 2004; 10(17): 2519-2523
- URL: https://www.wjgnet.com/1007-9327/full/v10/i17/2519.htm
- DOI: https://dx.doi.org/10.3748/wjg.v10.i17.2519


