Copyright
©The Author(s) 2004.
World J Gastroenterol. Aug 15, 2004; 10(16): 2383-2390
Published online Aug 15, 2004. doi: 10.3748/wjg.v10.i16.2383
Published online Aug 15, 2004. doi: 10.3748/wjg.v10.i16.2383
Figure 1 Sweat spot test (SST) for assessment of sympathetic autonomic nervous system[22,24,25].
The skin is coated with iodine and a fine emulsion of starch in arachis oil. Sweat is stimulated by intra-dermal injection of of 0.1 mL acetylcholine (the red dot indicates the point of injection). Denervated glands do not respond to the acetylcholine injection. A colorimetric reaction between starch and iodine is triggered by the sweat from stimulated glands, so that each pore appears as a small black dot after 2-5 min. A digital photo is taken and transferred to a magnifying software to measure the number and distribution of dots appearing in a standard squared grid of 529 mm2 divided into 64 squared subareas. A normal SST implied a score 12 dots/subarea and/or < 8% of abnormal subareas (each square of the grid having less than 6 dots) according to Ryder[24] and to our group[25]. Only patients with both indices (SST score and % abnormal subareas) outside normal limits were considered to have a positive test. A: Normal and even distribution of sweating glands seen as black dots; B: Defective response in a β -thalassemia major patient with sympathetic autonomic neuropathy.
Figure 2 Time-course of fasting and postprandial gallbladder volumes in 23 β -thalassemia major patients and 70 controls and expressed as mL (panel A) or percent fasting gallbladder volume (panel B).
Symbols indicate means, while vertical lines indicate SEM. Patients had impaired gallbladder emptying, with significantly increased fasting and postprandial volumes at each time point (panel A), in spite of similar contraction (panel B), compared to controls.
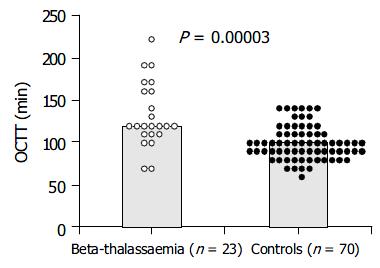
Figure 3 Orocecal transit time (OCTT) by lactulose H2-breath test in β -thalassemia major patients and controls.
Patients had significantly longer OCTT than controls. Data are expressed as individual points and means (bars).
Figure 4 Time-course of visual analogue scale (VAS) for appetite and satiety in β -thalassemia major patients and controls.
Data are mean ± SE. On the X-axis time “0” is before ingestion of test meal. Asterisks indicate significant differences of controls vs patients (0.0001 < P < 0.001, at various time-points and overall ANOVA).
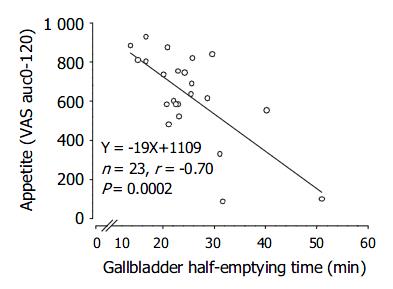
Figure 5 Correlation between appetite sensation (area under curve during 120 min of visual analogues scale) and speed of gallbladder emptying (half-emptying time) in β -thalassemia major patients.
Figure 6 Varations in individual fasting gallbladder volumes for each subgroup in β -thalassemia major patients.
A: Major changes in patients who developed biliary sludge: asterisks indicate significant differences, compared to the other two groups of patients (aP < 0.05 vs prior sludge/gallstones group and cP < 0.017 vs still anechoic group). B: Percent increased fasting gallbladder volume in the three groups of patients. The last bar represents those gallbladders with stones that developed additional sludge (n = 2).
- Citation: Portincasa P, Moschetta A, Berardino M, Ciaula AD, Vacca M, Baldassarre G, Pietrapertosa A, Cammarota R, Tannoia N, Palasciano G. Impaired gallbladder motility and delayed orocecal transit contribute to pigment gallstone and biliary sludge formation in β -thalassemia major adults. World J Gastroenterol 2004; 10(16): 2383-2390
- URL: https://www.wjgnet.com/1007-9327/full/v10/i16/2383.htm
- DOI: https://dx.doi.org/10.3748/wjg.v10.i16.2383


