Copyright
©The Author(s) 2004.
World J Gastroenterol. Aug 15, 2004; 10(16): 2369-2372
Published online Aug 15, 2004. doi: 10.3748/wjg.v10.i16.2369
Published online Aug 15, 2004. doi: 10.3748/wjg.v10.i16.2369
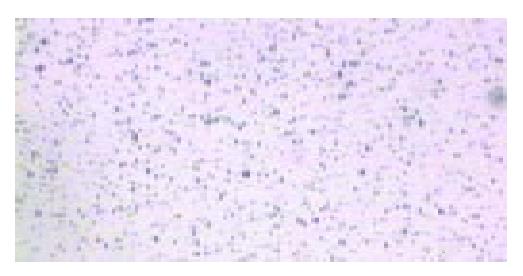
Figure 1 Microbubbles in 400-fold diluted saline (original magnification: × 100).
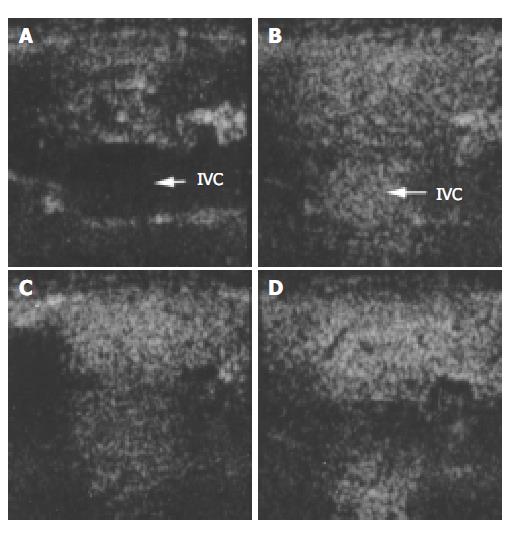
Figure 2 Ultrasound images of liver parenchyma and inferior vena cava (IVC) before and after the injection of microbubbles.
A: before injection; B: 30 s after injection; C: 1 min after injection; D: 2 min after injection.
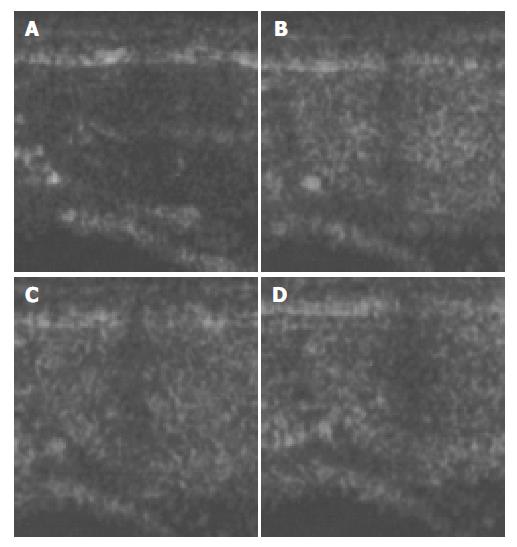
Figure 3 Ultrasound images of liver parenchyma and inferior vena cava (IVC) before and after the injection of microbubbles.
A: 15 min after injection; B: 25 min after injection; C: 30 min after the injection; D: 40 min after the injection.
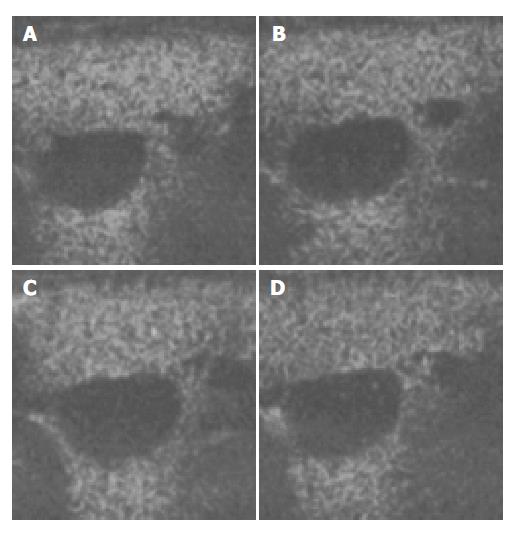
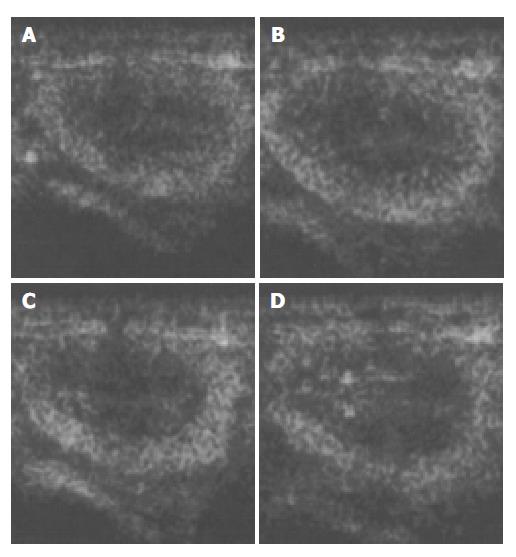
Figure 4 Ultrasound images of renal cortex before and after the injection of microbubbles.
A: before injection; B: 30 s after injection; C: 1 min after injection; D: 2 min after injection.
Figure 5 Ultrasound images of the renal cortex after injection of microbubbles.
A: 5 min after injection; B: 10 min after injection; C: 30 min after injection; D: 40 min after injection.
- Citation: Liu P, Gao YH, Tan KB, Liu Z, Zuo S. Grey scale enhancement of rabbit liver and kidney by intravenous injection of a new lipid-coated ultrasound contrast agent. World J Gastroenterol 2004; 10(16): 2369-2372
- URL: https://www.wjgnet.com/1007-9327/full/v10/i16/2369.htm
- DOI: https://dx.doi.org/10.3748/wjg.v10.i16.2369


