Copyright
©The Author(s) 2004.
World J Gastroenterol. Aug 15, 2004; 10(16): 2327-2329
Published online Aug 15, 2004. doi: 10.3748/wjg.v10.i16.2327
Published online Aug 15, 2004. doi: 10.3748/wjg.v10.i16.2327
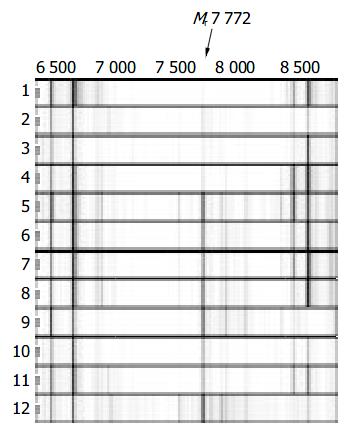
Figure 1 SELDI-TOF mass spectra.
Spectra 1-4 from HBV-induced LC patients, 5-8 from healthy men, and 9-12 from HCC patients. A biomarker of Mr 7772 was present in non-cirrhotic group, but not in LC serum samples.
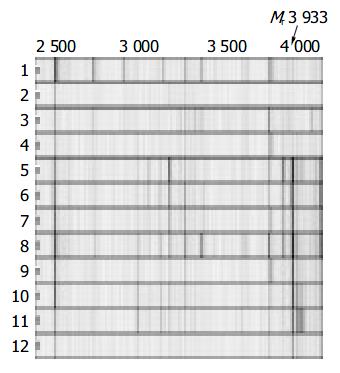
Figure 2 SELDI-TOF mass spectra.
Spectra 1-4 from HBV in-duced LC patients, 5-8 from healthy men, and 9-12 from HCC patients. A biomarker of Mr 3933 was present in non-cirrhotic group, but not in LC serum samples.
Figure 3 Tree structure and sample distribution.
The root node and descendant nodes are indicated in gray, and the ter-minal nodes are shown in black. Peaks with Mr 7772 and 3933 were chosen to set up the decision tree.
- Citation: Zhu XD, Zhang WH, Li CL, Xu Y, Liang WJ, Tien P. New serum biomarkers for detection of HBV-induced liver cirrhosis using SELDI protein chip technology. World J Gastroenterol 2004; 10(16): 2327-2329
- URL: https://www.wjgnet.com/1007-9327/full/v10/i16/2327.htm
- DOI: https://dx.doi.org/10.3748/wjg.v10.i16.2327


